
Ethereum price broke the key $1,600 resistance against the US Dollar. ETH could rally further if it clears the $1,700 resistance zone in the near term.
- Ethereum is up over 10% and cleared the $1,600 resistance.
- The price is now trading above $1,600 and the 100 hourly simple moving average.
- There is a key bullish trend line forming with support near $1,640 on the hourly chart of ETH/USD (data feed via Kraken).
- The pair could continue to move up if it clears the $1,700 resistance zone.
Ethereum Price Surges Over 10%
Ethereum price started a strong increase after the bulls were active above the $1,500 support. ETH cleared many hurdles near $1,570 and $1,600 to move into a positive zone, similar to bitcoin.
The price is up over 10% and there was a move above the $1,650 resistance. It retested the $1,700 zone. A high is formed near $1,700 and the price is now consolidating gains. Ether price is now trading well above $1,600 and the 100 hourly simple moving average. There is also a key bullish trend line forming with support near $1,640 on the hourly chart of ETH/USD.
It is also above the 23.6% Fib retracement level of the recent rally from the $1,544 swing low to $1,700 high. On the upside, the price is facing resistance near the $1,700 level.
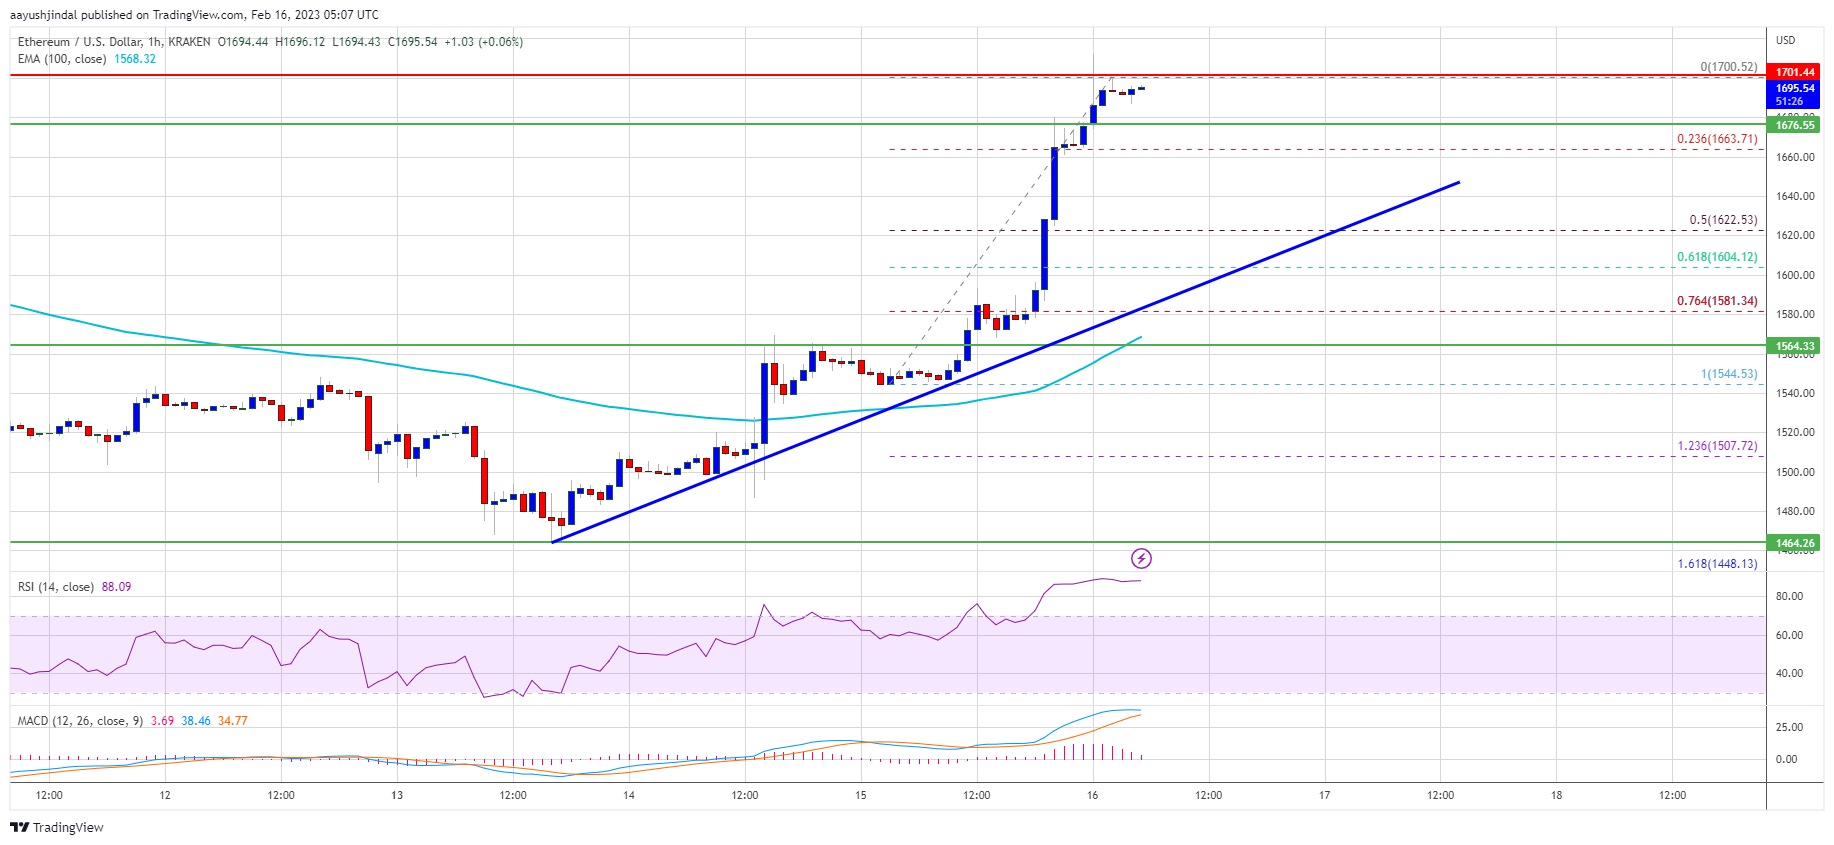
Source: ETHUSD on TradingView.com
The next major resistance is near the $1,780 zone. An upside break above the $1,780 resistance zone could spark more upsides. In the stated case, the price may perhaps rise towards the $1,840 resistance. The next major resistance is near the $2,000 level.
Dips Supported in ETH?
If ethereum fails to clear the $1,700 resistance, it could start a downside correction. An initial support on the downside is near the $1,660 level.
The next major support is near the $1,640 zone or the trend line or the 50% Fib retracement level of the recent rally from the $1,544 swing low to $1,700 high. If there is a break below $1,640, the price might continue to drop and move towards the $1,600 support. Any more losses might call for a test of the $1,550 level.
Technical Indicators
Hourly MACD – The MACD for ETH/USD is now gaining momentum in the bullish zone.
Hourly RSI – The RSI for ETH/USD is now in the overbought zone.
Major Support Level – $1,640
Major Resistance Level – $1,700