
Ethereum price is recovering above the $1,850 zone against the US Dollar. ETH could restart its decline if there is no move above the $1,900 resistance.
- Ethereum is slowly moving higher above the $1,850 zone.
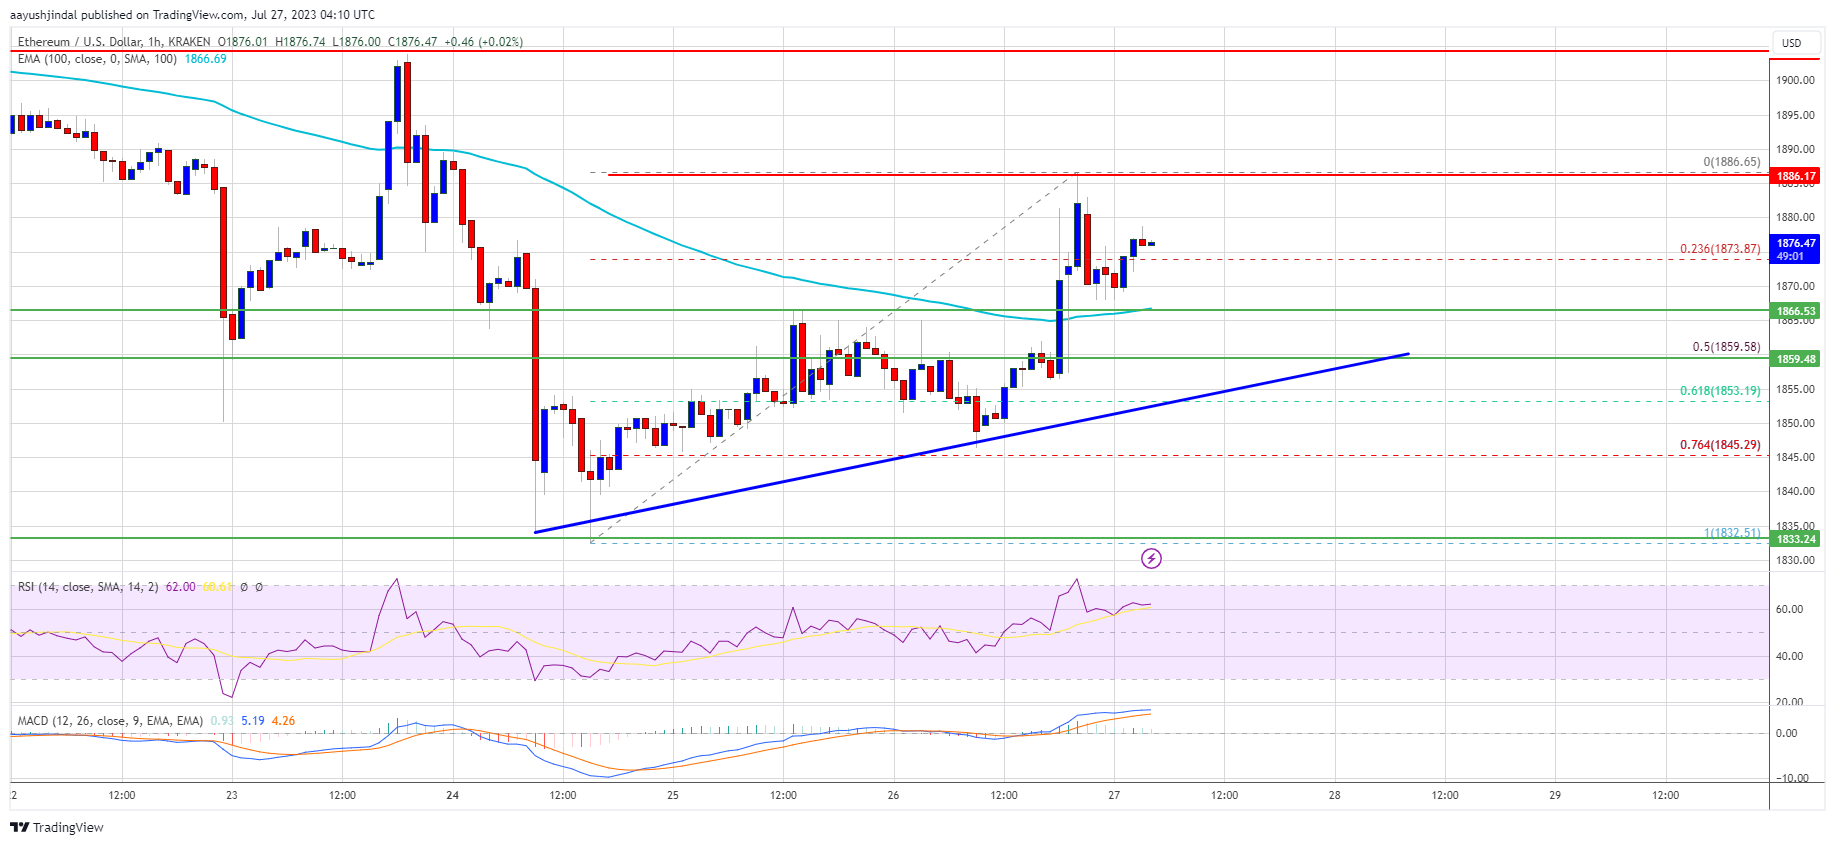
- The price is trading above $1,870 and the 100-hourly Simple Moving Average.
- There is a key bullish trend line forming with support near $1,855 on the hourly chart of ETH/USD (data feed via Kraken).
- The pair could face a strong selling interest near the $1,900 and $1,920 levels.
Ethereum Price Faces Uphill Task
Ethereum’s price started a short-term recovery wave from the $1,830 zone. ETH was able to recover above the $1,850 and $1,860 levels, similar to Bitcoin.
However, the bears are still active below the $1,900 level. A high is formed near $1,886 and the price is now consolidating gains. There was a minor decline below the 23.6% Fib retracement level of the upward move from the $1,832 swing low to the $1,886 high.
Ether is now trading above $1,870 and the 100-hourly Simple Moving Average. There is also a key bullish trend line forming with support near $1,855 on the hourly chart of ETH/USD. The trend line is near the 50% Fib retracement level of the upward move from the $1,832 swing low to the $1,886 high.
On the upside, immediate resistance is near the $1,885 level and the recent high. The first major resistance is near the $1,900 level. The next key resistance is near the $1,920 level. A close above the $1,920 resistance could set the pace for a larger increase.
Source: ETHUSD on TradingView.com
The next resistance is near the $1,975 zone, above which the price might rise toward the $2,000 hurdle. Any more gains could send Ether toward the $2,050 resistance in the near term.
Fresh Decline in ETH?
If Ethereum fails to clear the $1,900 resistance, it could start a fresh decline. Initial support on the downside is near the $1,865 level and the 100 hourly SMA.
The first major support is near the $1,855 zone or the trend line, below which the price might move into a bearish zone. The next major support is near the $1,830 support level.
Technical Indicators
Hourly MACD – The MACD for ETH/USD is losing momentum in the bullish zone.
Hourly RSI – The RSI for ETH/USD is now above the 50 level.
Major Support Level – $1,855
Major Resistance Level – $1,900