
Ethereum price is attempting a fresh increase above $1,650 against the US Dollar. ETH could accelerate higher if it clears the $1,670 resistance.
- Ethereum is attempting a fresh increase above the $1,620 level.
- The price is trading above $1,620 and the 100-hourly Simple Moving Average.
- There is a key bullish trend line forming with support near $1,645 on the hourly chart of ETH/USD (data feed via Kraken).
- The pair could continue to rise if it clears the $1,670 resistance zone.
Ethereum Price Climbs Higher
Ethereum’s price formed a base above the $1,580 level. ETH remained stable and climbed above the $1,620 resistance zone to move into a positive zone, like Bitcoin.
There was a move above the $1,650 level but upsides were limited. A high was formed near $1,667 and there was a minor downside correction. The price is now trading near the 23.6% Fib retracement level of the upward move from the $1,583 swing low to the $1,667 high.
Ethereum is trading above $1,640 and the 100-hourly Simple Moving Average. There is also a key bullish trend line forming with support near $1,645 on the hourly chart of ETH/USD.
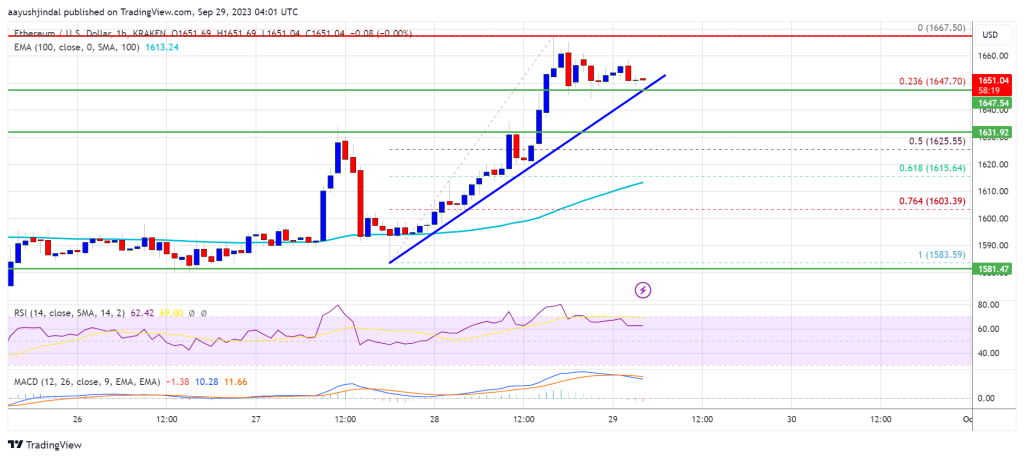
Source: ETHUSD on TradingView.com
On the upside, the price might face resistance near the $1,670 level. The next major resistance is $1,720. A clear move above the $1,720 resistance zone could set the pace for a larger increase. In the stated case, the price could visit the $1,800 resistance. The next key resistance might be $1,820. Any more gains might open the doors for a move toward $1,880.
Are Dips Limited in ETH?
If Ethereum fails to clear the $1,670 resistance, it could a downside correction. Initial support on the downside is near the $1,645 level and the trend line.
The next key support is $1,620 or the, below which the price could test the $1,600 support. A downside break below the $1,600 support might start another bearish wave. In the stated case, there could be a drop toward the $1,540 level.
Technical Indicators
Hourly MACD – The MACD for ETH/USD is losing momentum in the bullish zone.
Hourly RSI – The RSI for ETH/USD is now above the 50 level.
Major Support Level – $1,620
Major Resistance Level – $1,670