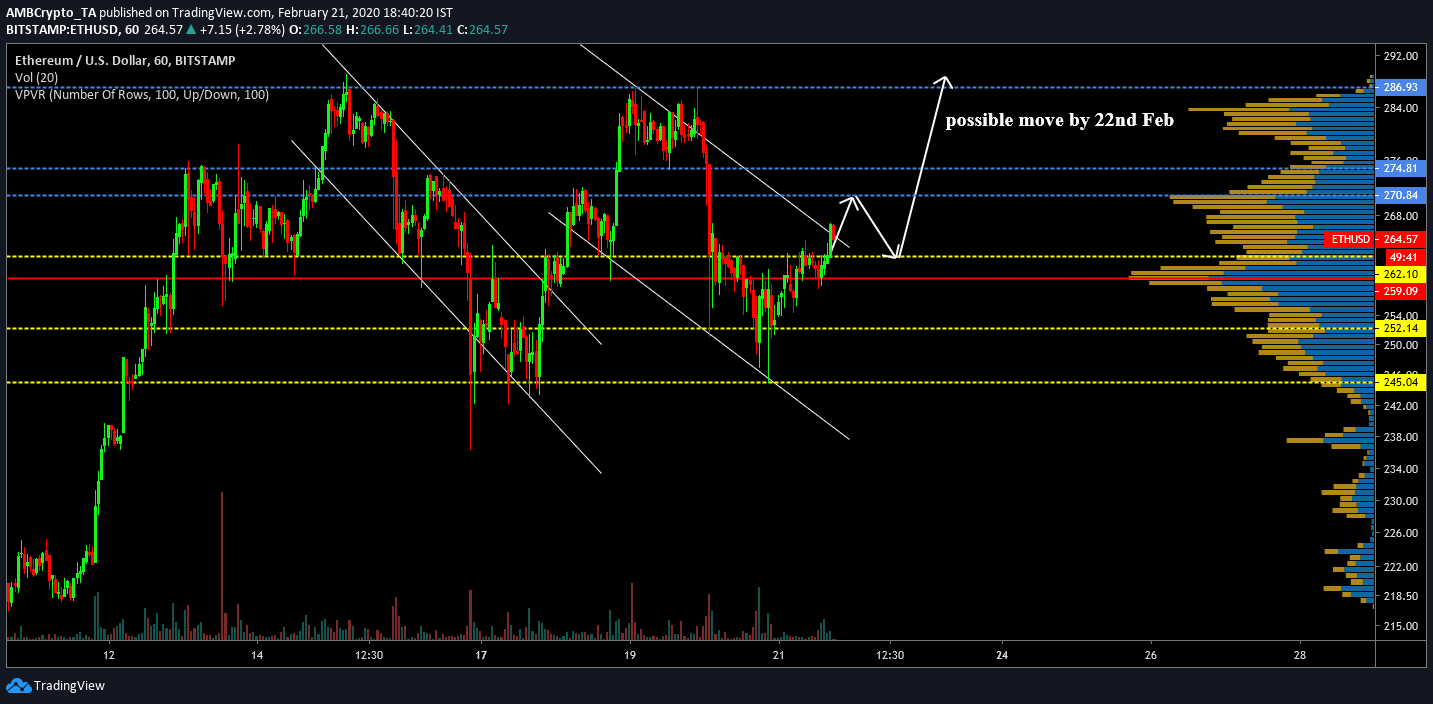
Ethereum‘s 12.43 percent drop on 19 February led to an unexpected slump from $283.82, all the way down to $252.14. Major support levels at $274.81, $270.84, $262.10, all turned to become resistance for a brief period. The pullback continued till 12:00 UTC on 20 February, after which the price underwent some recovery.
According to CoinMarketCap, Ethereum registered a growth of 3.08 percent over the last 24-hours and its market cap remained under $30 billion.
Ethereum 1-hour chart
Ethereum’s short-term chart pictured the formation of two descending channels over the past 8 days. The first descending channel highlighted ETH‘s re-test at $245.04 support levels, but the bounce-back allowed the token to scale above $280. The second descending channel which appeared as a mirror repetition of the first took place over the last 48 hours.
With the token already undergoing recovery, based on past performance, the possibility of a re-test at $270.84 is high. The trading activity at the mentioned resistance has been significant, according to the VPVR indicator, which underlined the higher volume at $270.84. ETH may dip again till $262.10 afterward, but another rally would take its valuation near above the $280 again.
As observed in the chart, ETH has already tested the resistance at $286.93 over the past 8 days, and a third re-test may trigger a move above the marked line. In spite of the resistance at $274.04, due to low trading volume, a strong re-test at this point is less likely.

Source: TradingView
Short-term indicators remained in favor of Ethereum’s bullish rally as well, with the Relative Strength Index appearing largely bullish after the recent dip. The MACD line remained above the signal line as well, something that exhibited a bullish continuation on the charts.
Conclusion
Historically, the likelihood of Ethereum marching above $286 is high because of the previous retest on 15th and 18th February. The token should be able to sustain a rally above $286 over the next few days and consolidate at a higher range after that.

