- L2 protocols on the Ethereum blockchain reached a monthly all-time high with Optimism and Arbitrum leading the front
- The Ethereum network was still struggling with sustaining a improved momentum
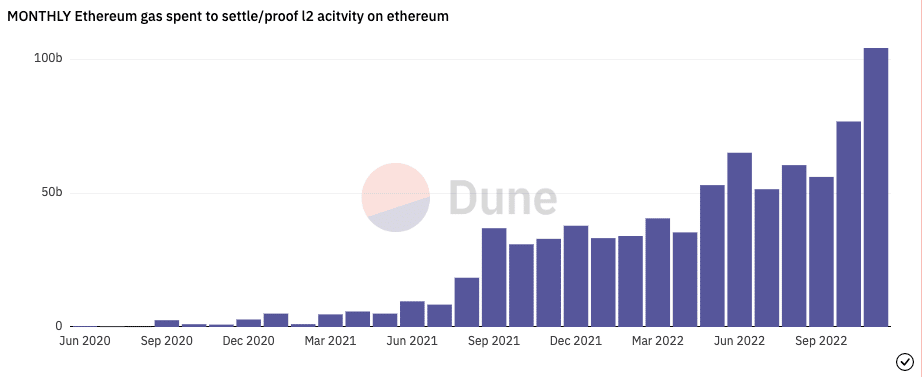
Ethereum [ETH] layer-two (L2) protocols hit another landmark in proving its 2022 increased adoption as the gas consumption hit a monthly all-time high. This milestone was revealed by Paolo Rebuffo, a senior blockchain advisor and crypto entrepreneur.
According to Rebuffo, who hosted a tracking profile on Dune Analytics, the monthly gas usage on the Ethereum chain hit 104 billion at press time. Interestingly, this was the first time that the monthly gas consumption crossed the 100 billion mark.

Source: Dune Analytics
Read Ethereum’s [ETH] Price Prediction 2023-2024
Brace for impact!
Based on the data from Dune, the landmark would have been unattainable without the input of certain L2 protocols. This was due to the fact that the consumption as of January 2022 was only 33.26 billion. Furthermore, protocols like Optimism [OP], Arbitrum, and ZkSync only began gaining massive attention after this period.
According to the information on Dune, Optimism led the pack, accounting for almost 50% of the gas used. This was followed by Arbitrum, which dominated the likes of Loopring, DYDX, and Aztec. This meant more transactions passed through the Optimism and Arbitrum network than any other L2 protocol on the Ethereum blockchain.
This might not be astonishing, especially as MakerDAO [MKR] lately made moves to integrate Optimism. It was also evident as DeFiLlama showed that both scaling solutions had better value per Total Value Locked (TVL). At press time, OP’s TVL was $524.04 million. In Arbitrum’s case, the TVL was $933.85 million.
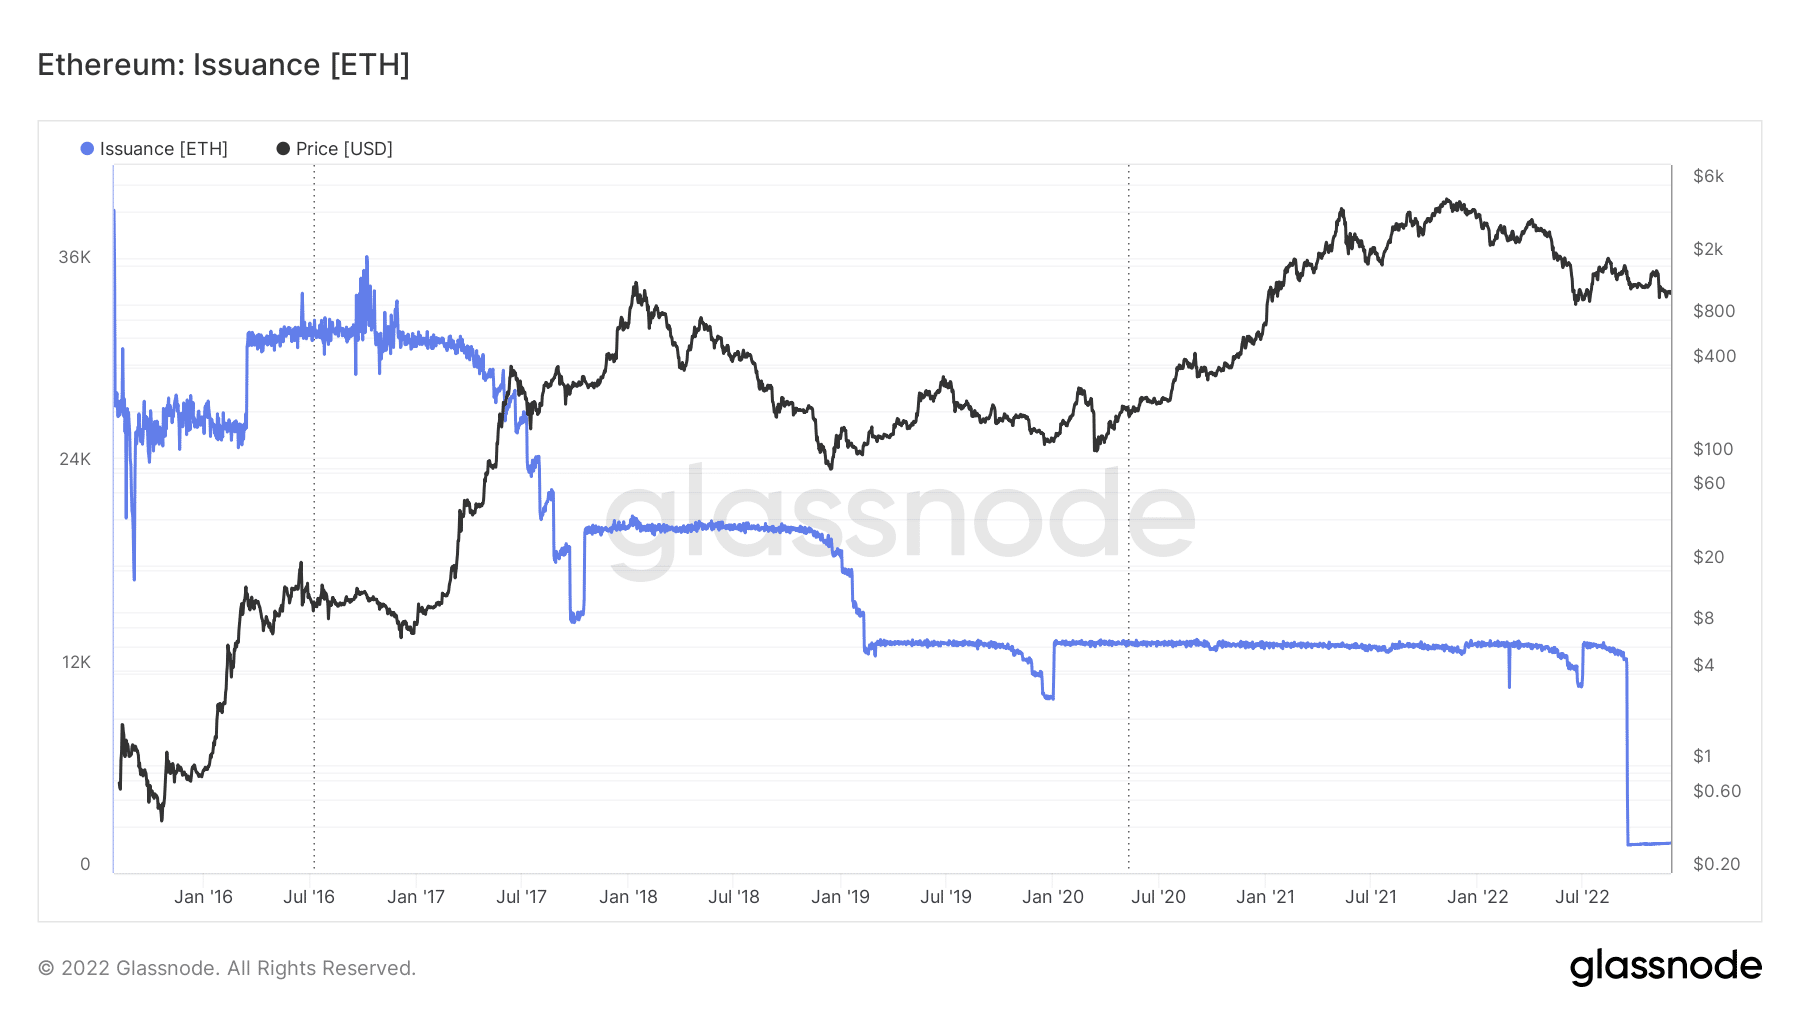
Despite the increase, Ethereum’s supply of new coins had remained around the same state as in October. Glassnode data showed that issuance on the ETH network was 17564.93. This represented only a slight increase from the value on 21 November. The implications also inferred that fewer ETH were in circulation as compared to the highs recorded before the Merge.
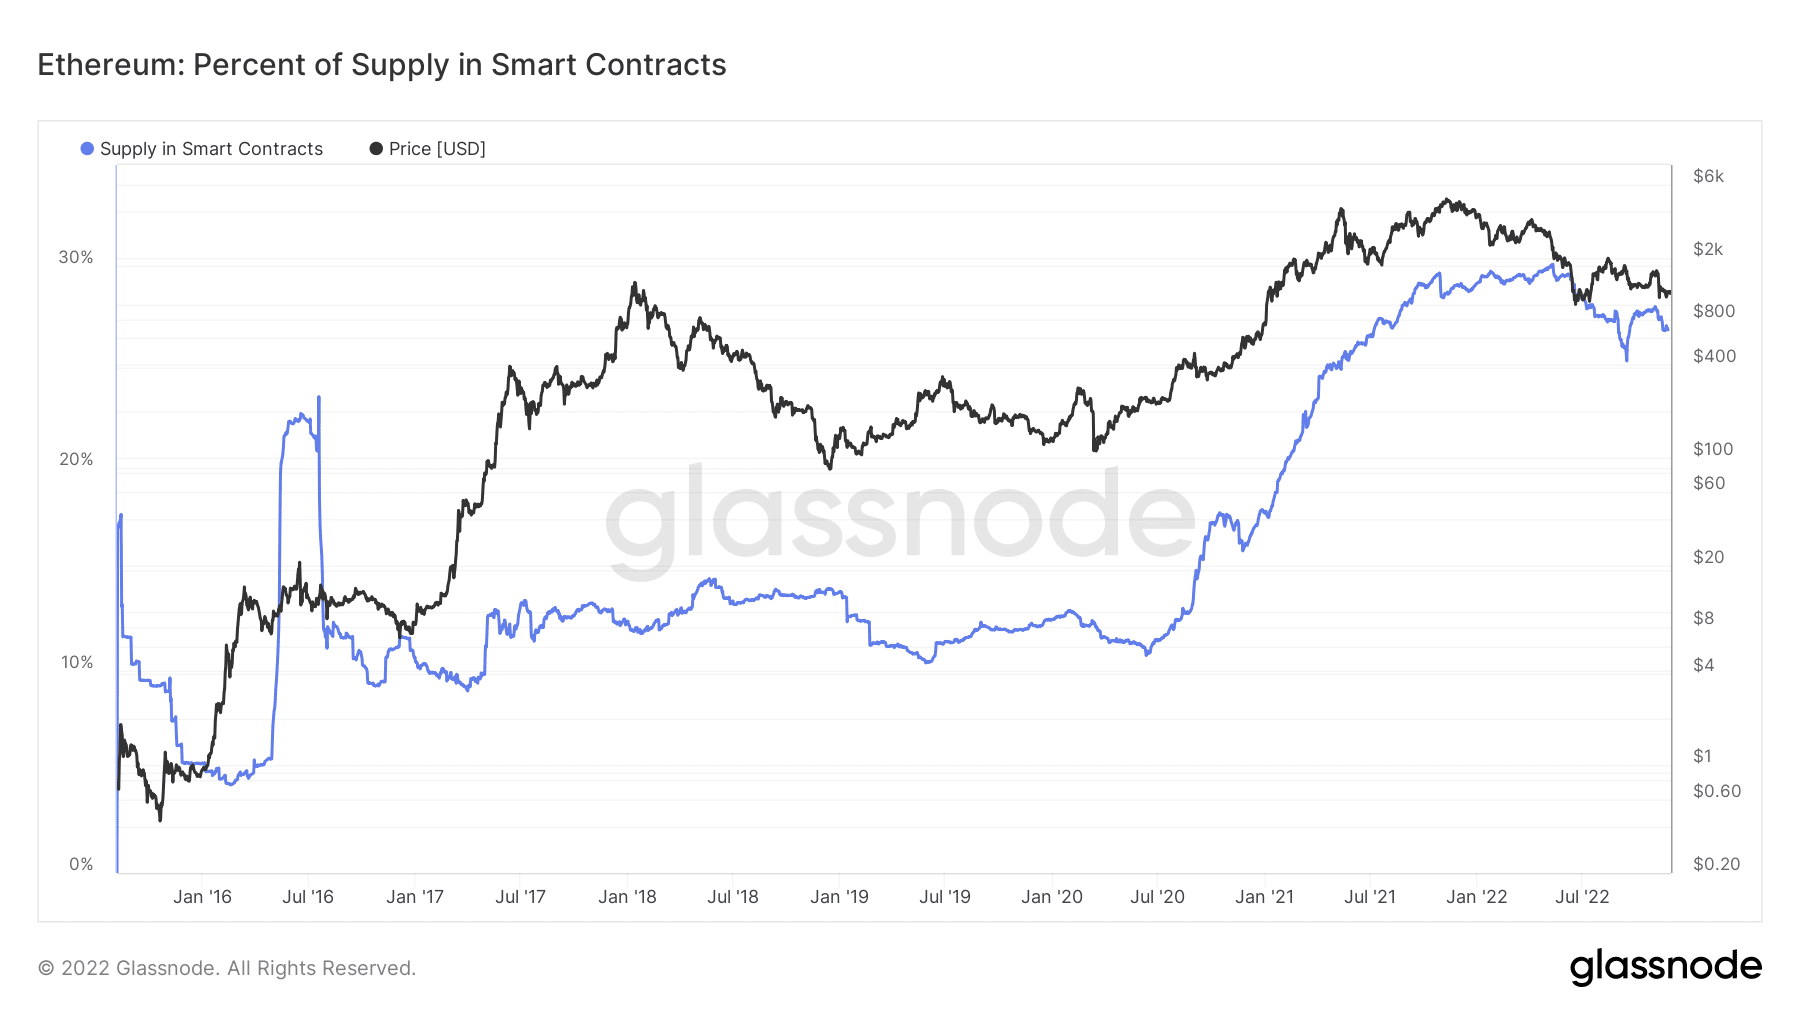
However, the smart contract supply on the chain seemed to have maintained stability. Data from Glassnode revealed that the total supply of ETH held in smart contracts was 28.89%. This meant that a sizable number of the self-executing applications had been deployed on the Ethereum blockchain.
Network in disorder but…
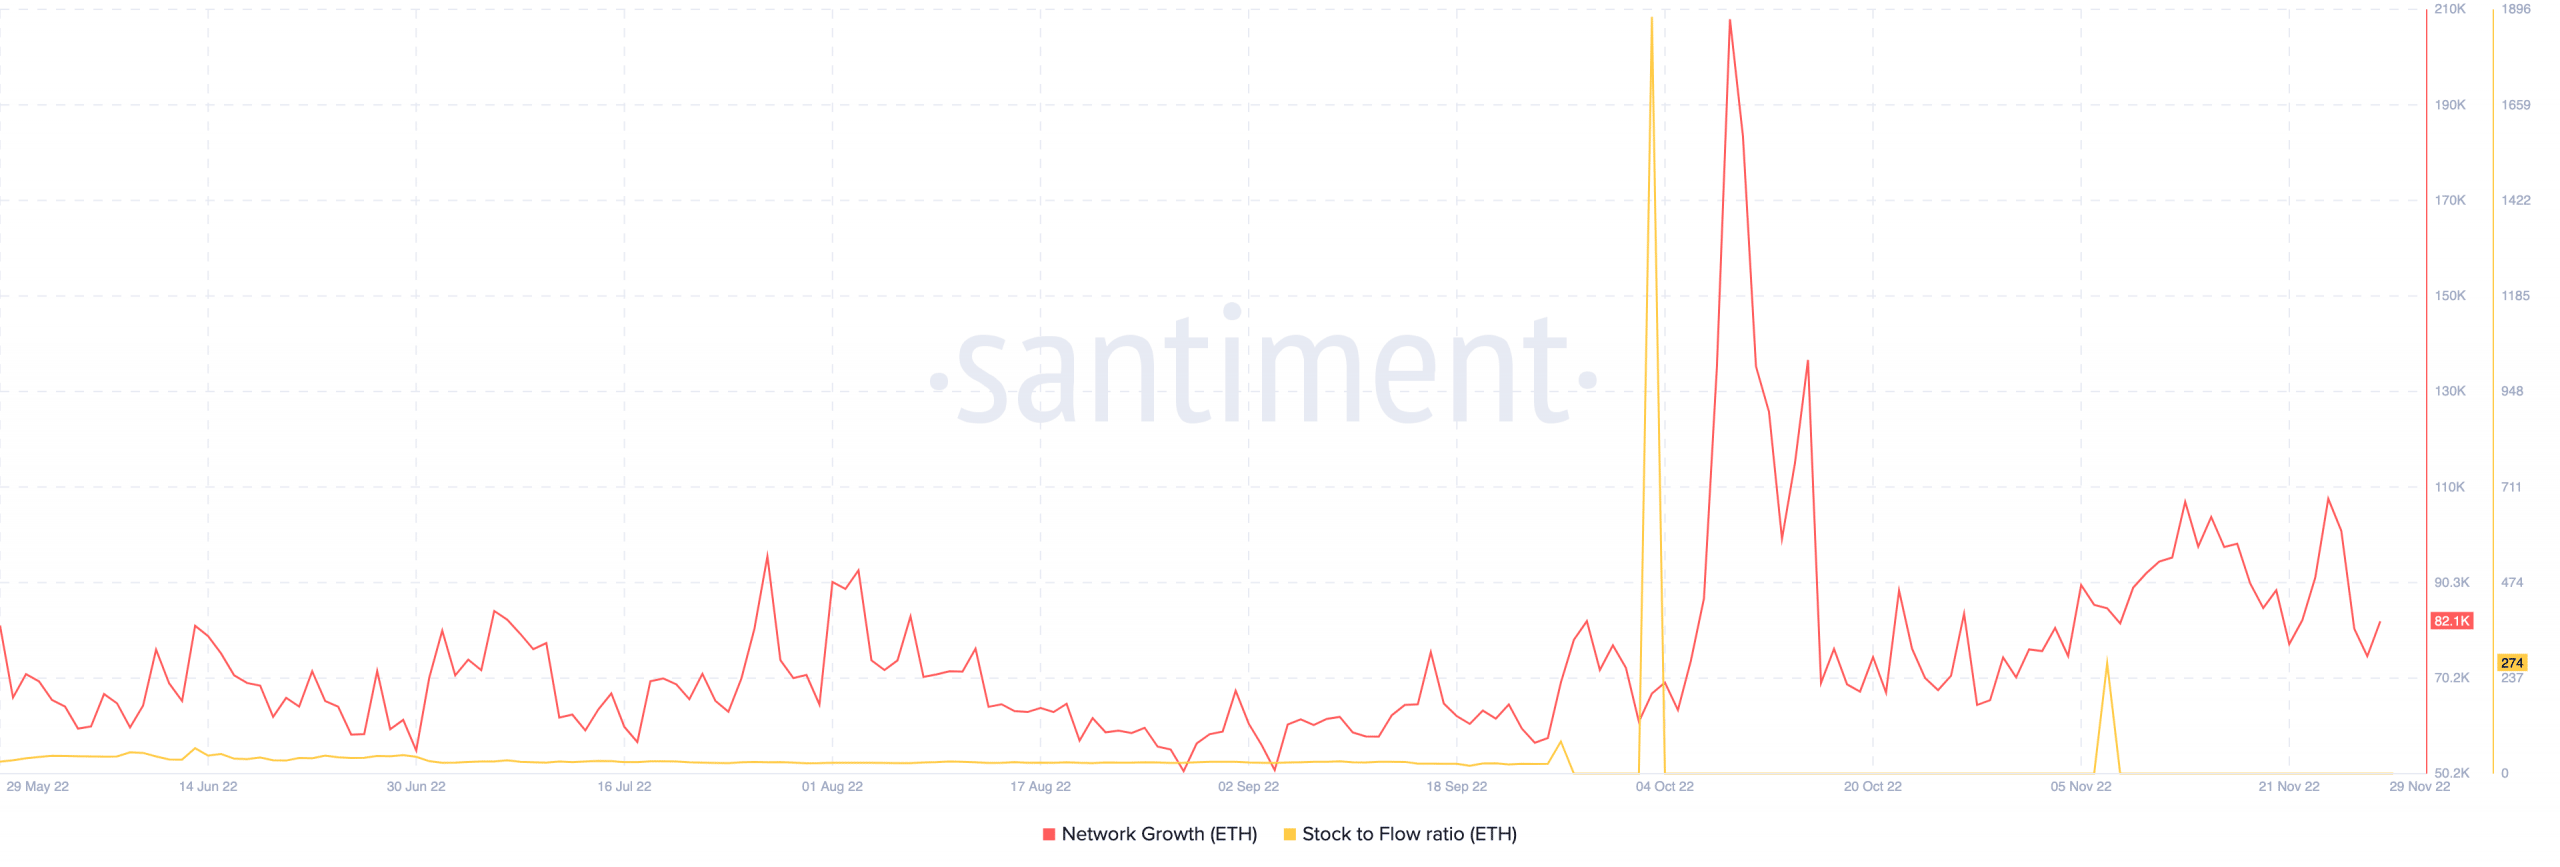
While Ethereum might have experienced improved L2 activity, the network prevailed in disarray. As of this writing, Santiment showed that the network growth was 82,100. Although this value was an increment from 27 November, it still signified that the number of new addresses interacting with Ethereum was relatively low.
In addition, the stock-to-flow- ratio of 274 meant that the ETH was scarce in supply. Hence, the coming days might not be able to produce an increased circulation of the altcoin.


