ETH price started an upside correction and climbed above the $125 resistance against the US Dollar.The price is currently consolidating above $125 and it could continue to recover.There is a key bearish trend line forming with resistance near $132 on the 4-hours chart of ETH/USD (data feed via Kraken).The pair could dip a few points, but it remains well supported near $125 and $122.Ethereum price is holding a few important supports against the US Dollar, similar to bitcoin. ETH price is likely to recover further as long as it is above $122.Ethereum Price Weekly AnalysisThis past week, Ethereum started a nice recovery wave from the $115 swing low against the US Dollar. ETH price climbed above the $120 and $125 resistance levels to start a decent recovery.Moreover, there was a close above the $125 level and the 100 simple moving average (4-hours). It opened the doors for more gains above the $130 level. Finally, the price tested the $135 resistance, where sellers appeared.A high was formed near $135 and the price started correcting gains. It traded below the $130 level. Besides, there was a break below the 23.6% Fib retracement level of the recovery wave from the $115 low to $135 high.However, there are many decent supports on the downside near $125 and $122. Additionally, the 50% Fib retracement level of the recovery wave from the $115 low to $135 high is also near the $125 level.If there is a downside break below the $125 and $122 support levels, Ethereum price might decline towards the $120 support level. Any further losses could restart the downtrend and spark a fresh bearish wave below $115.On the upside, there are a few hurdles near the $132 and $135 levels. There is also a key bearish trend line forming with resistance near $132 on the 4-hours chart of ETH/USD.Therefore, a successful close above the $132 and $135 resistance levels will most likely ignite another upward move. The next key hurdle is near the $140 level, above which the price is likely to increase towards the $150 level.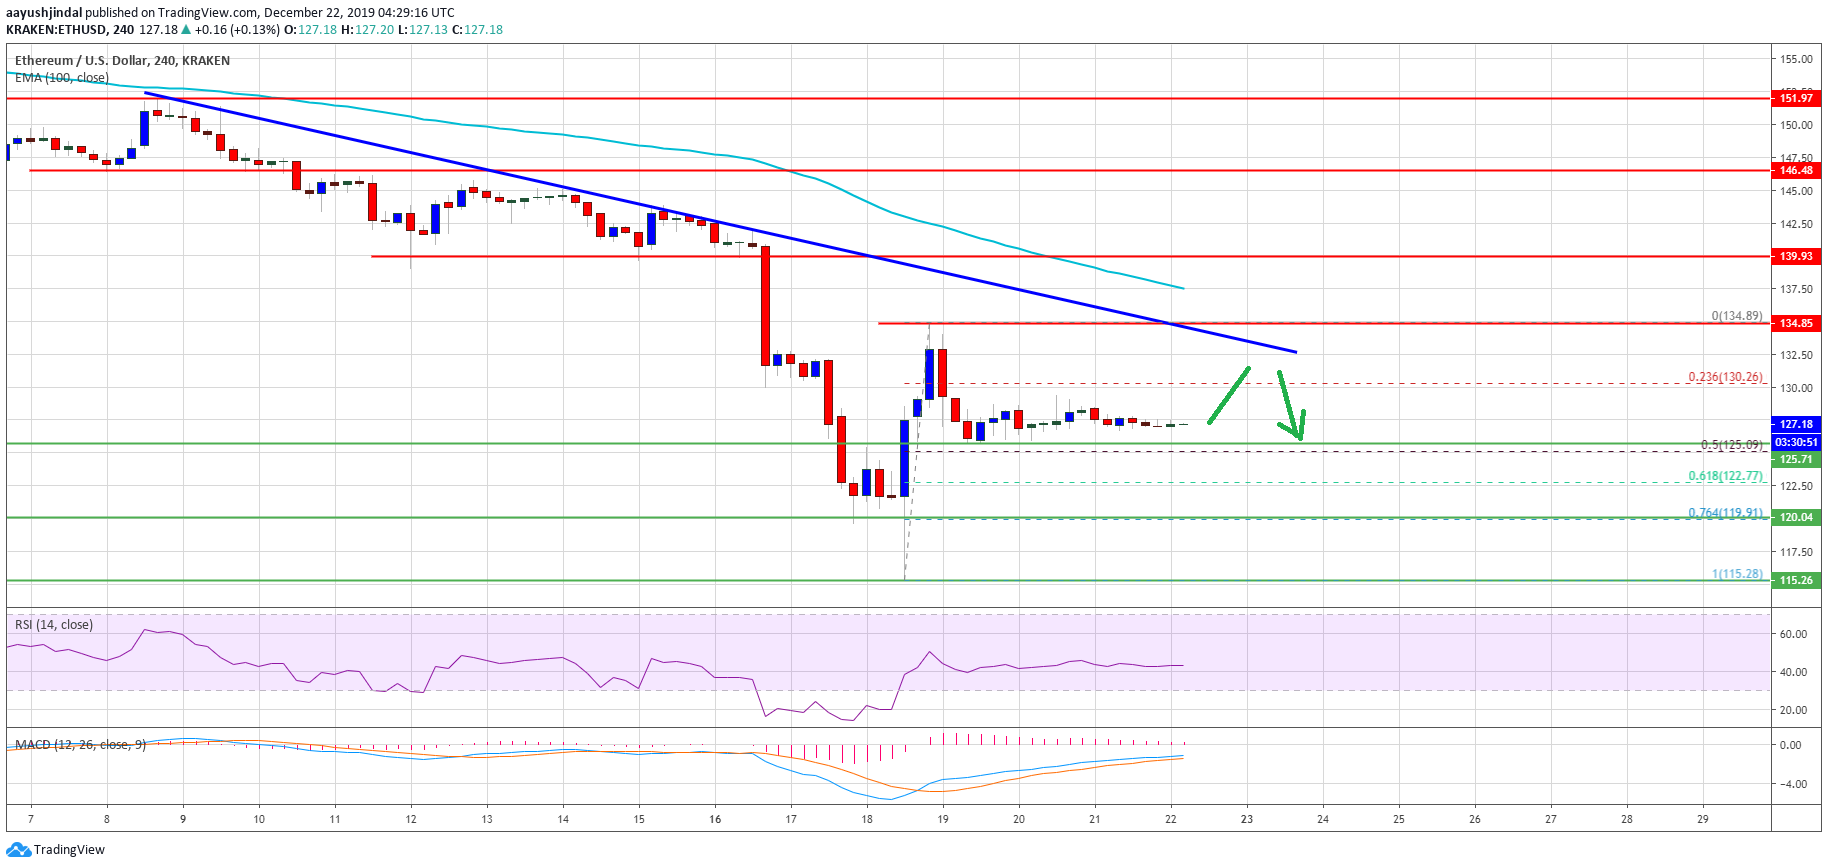 Ethereum PriceThe above chart indicates that Ethereum price is trading above a few important uptrend supports near $122. As long as there is no daily close below $120, there are chances of another wave above the $130 level in the near term.Technical Indicators4 hours MACD – The MACD for ETH/USD is slowly losing strength in the bullish zone.4 hours RSI – The RSI for ETH/USD is currently flat and below the 50 level.Major Support Level – $122Major Resistance Level – $135
Ethereum Watch
ETHEREUM and ICO TOKENS
