
After registering a yearly high of $289 on 14th Feb, Ethereum’s valuation has dropped under key supports levels at $279, $255 and $229 over the past two weeks. Consecutive slip-ups on 15th, 19th, and 24th February led to a slump of 26 percent, with the price stooping as low as $211.
At press time, ETH exhibited a value of $224.59 with a market cap of just under $25 billion.
Ethereum 1-day chart
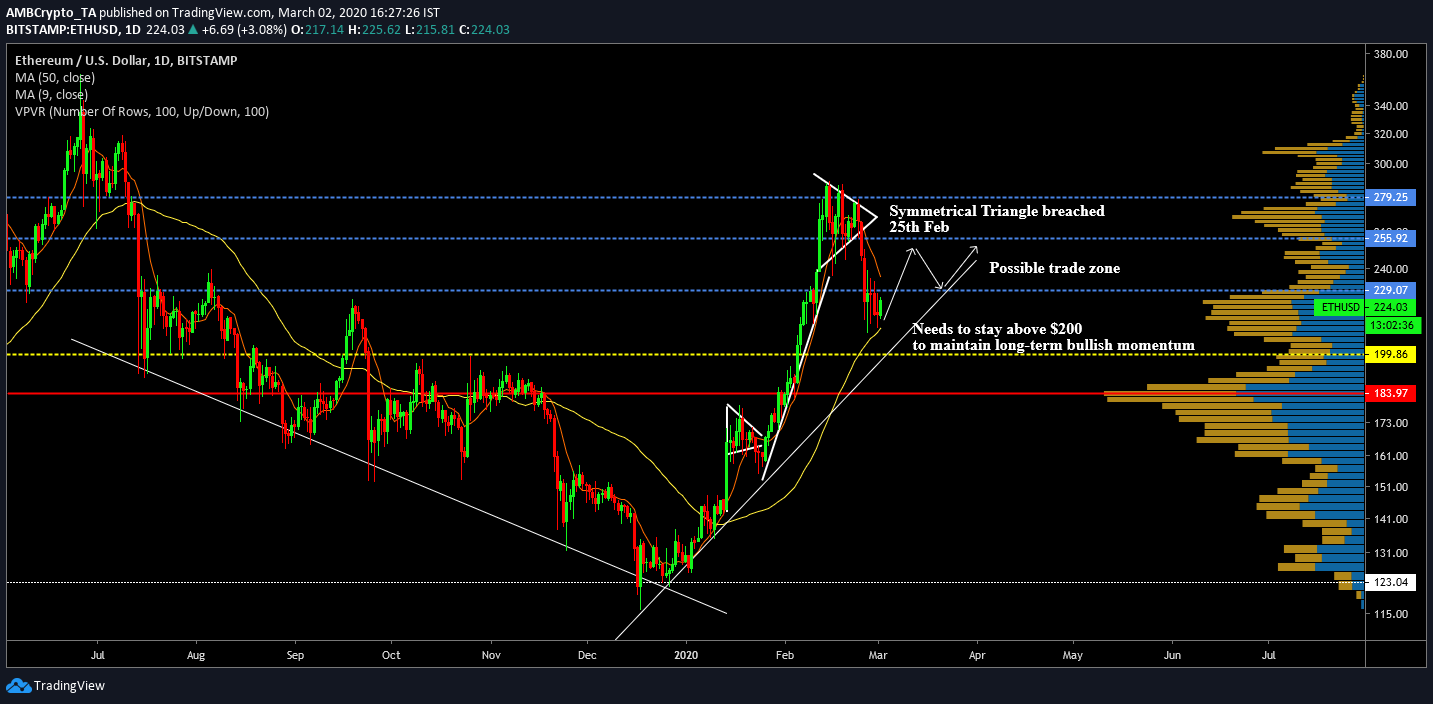
The 1-day chart of Ethereum continued to appear bullish with the price picturing a steep incline following the major downslide over the second half of 2019. Ethereum’s late bullish rally during the end of January surfaced after the price broke out of a bullish flag.
In between 12th February and 25th February, a symmetrical triangle started taking shape and even though many expected a bullish hike, Ethereum’s valuation nose-dived and breached key support levels. At press time, ETH continued to consolidate under the $229 resistance mark.
The trading volume between $200 and $230 for Ethereum has been high since 2019, as indicated by the VPVR indicator. However, after consecutive corrections over the past two weeks, the possibility for the token to undergo a trend reversal is high.
To maintain a sense of bullishness in the market, it is imperative for Ethereum to stay above support levels at $200. A slump below the aforementioned support would directly nullify Ethereum’s entire gains from February.
The 50-Moving Average continued to act as support for the price but the MA-line was at close proximity, suggesting a reversal at press time.
An ideal movement for Ethereum should see the token breach above $229 over the next week and consolidate between $229 and $255.
Gann Fan Movement
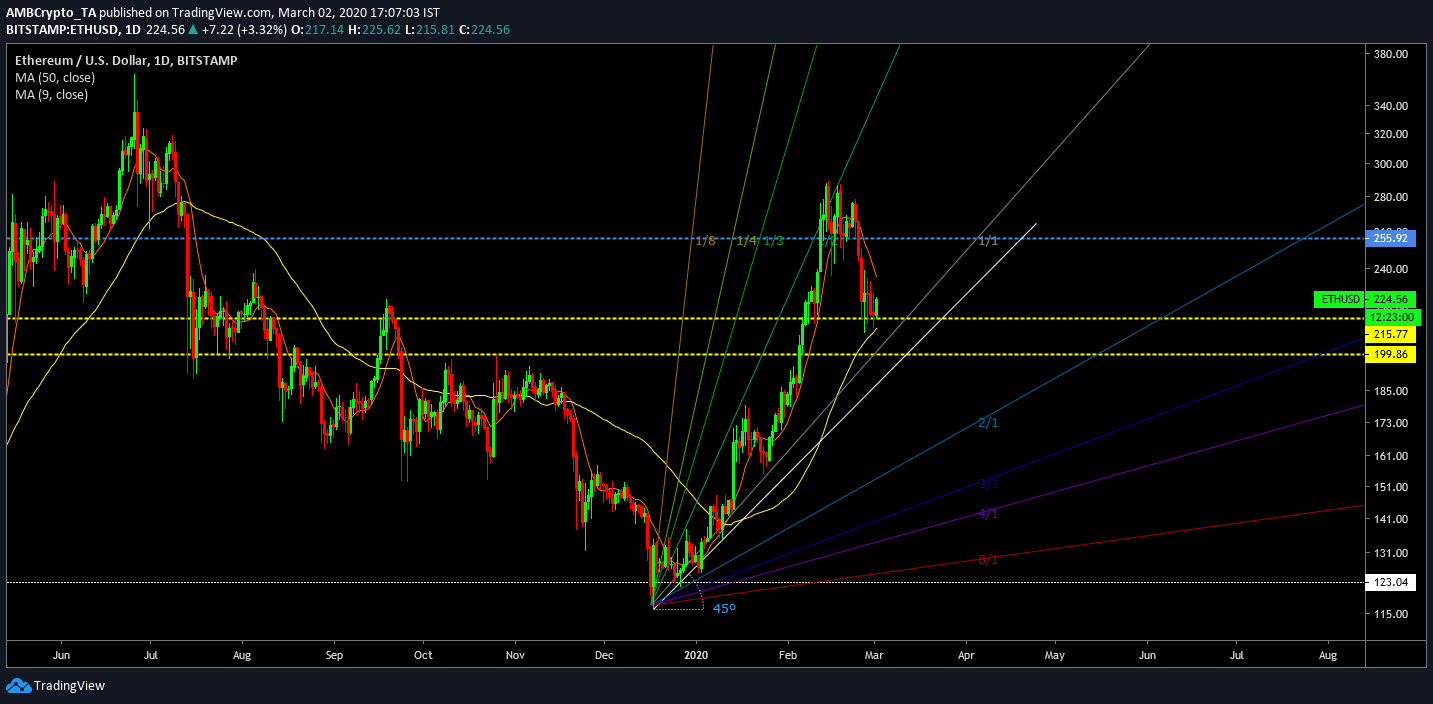
ETH/USD on Trading View
On observing the Gann fan indicator, Ethereum’s long-term bullish momentum remains intact as the price continued to mediate above the 1:1 ratio line. According to the above analysis, by the end of March, ETH should manage to scale above $255 again or else the bearish pressure may take over the bullish momentum.
Conclusion
Ethereum would need to steady its price over the next two weeks and consolidate higher in the charts. Major long-term indicators continue to promote a bullish outlook.