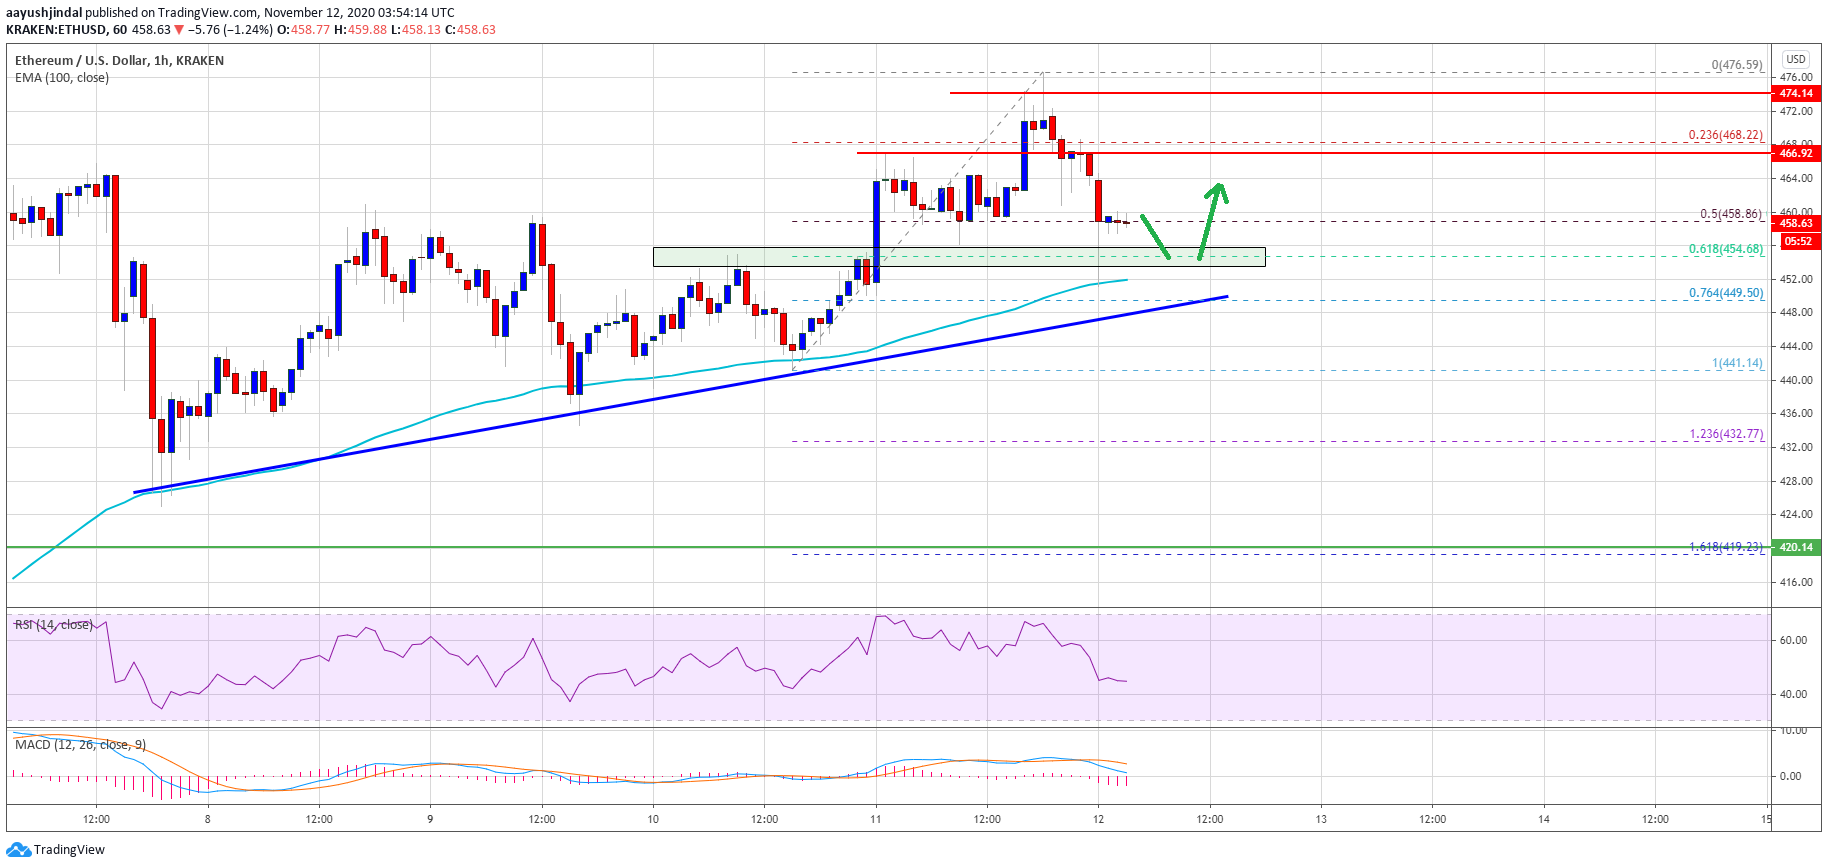
Ethereum extended its rise above the $465 resistance against the US Dollar. ETH price traded to a new monthly high near $477 and recently started a downside correction.
- Ethereum is still following a nice bullish path above the $450 and $455 support levels.
- The price traded to a new monthly high near $477 and settled above the 100 hourly simple moving average.
- There is a crucial bullish trend line forming with support near $452 on the hourly chart of ETH/USD (data feed via Kraken).
- The pair remains well supported near $450 and it might resume its rise above $470.
Ethereum Price is Trading in a Positive Zone
There was a steady rise in Ethereum above the $455 and $460 resistance levels. ETH price even broke the $465 resistance level and settled well above the 100 hourly simple moving average.
It even traded to a new monthly high near $477 and recently started a downside correction. Ether price corrected below the $465 level. It is now testing the 50% Fib retracement level of the recent rise from the $441 swing low to $477 high.
The first key support is near the $454 level (a multi-touch zone). There is also a crucial bullish trend line forming with support near $452 on the hourly chart of ETH/USD. The trend line is close to the 76.4% Fib retracement level of the recent rise from the $441 swing low to $477 high.

Source: ETHUSD on TradingView.com
On the upside, the $467 level is a short-term resistance for the bulls. The first major hurdle is near the $475 level, above which the price could surge above $477 and $480. The next major resistance is near the $488 level, above which ether price might visit the $500 handle.
Downsides Limited in ETH?
If there are more losses below the $458 level, Ethereum might find a strong buying interest near the $454 and $452 support levels.
The 100 hourly simple moving average is also positioned just above the $450 support level. Therefore, a break below the $450 support zone could spark a sharp bearish move. The next major support below the $450 zone could be near the $432 level.
Technical Indicators
Hourly MACD – The MACD for ETH/USD is slowly losing momentum in the bearish zone.
Hourly RSI – The RSI for ETH/USD is now just below the 50 level.
Major Support Level – $452
Major Resistance Level – $467
