
It has been close to 2 weeks since the market crash took place and since then, the charts of major assets have significantly stabilized. Ethereum continued to exhibit sideways movement between $123 and $135 but at press time, it remained just above the resistance at $135.
At press time, the market cap continued to be just above $15 billion dollars and in the past 24-hours its valuation hiked by a mere 0.17 percent.
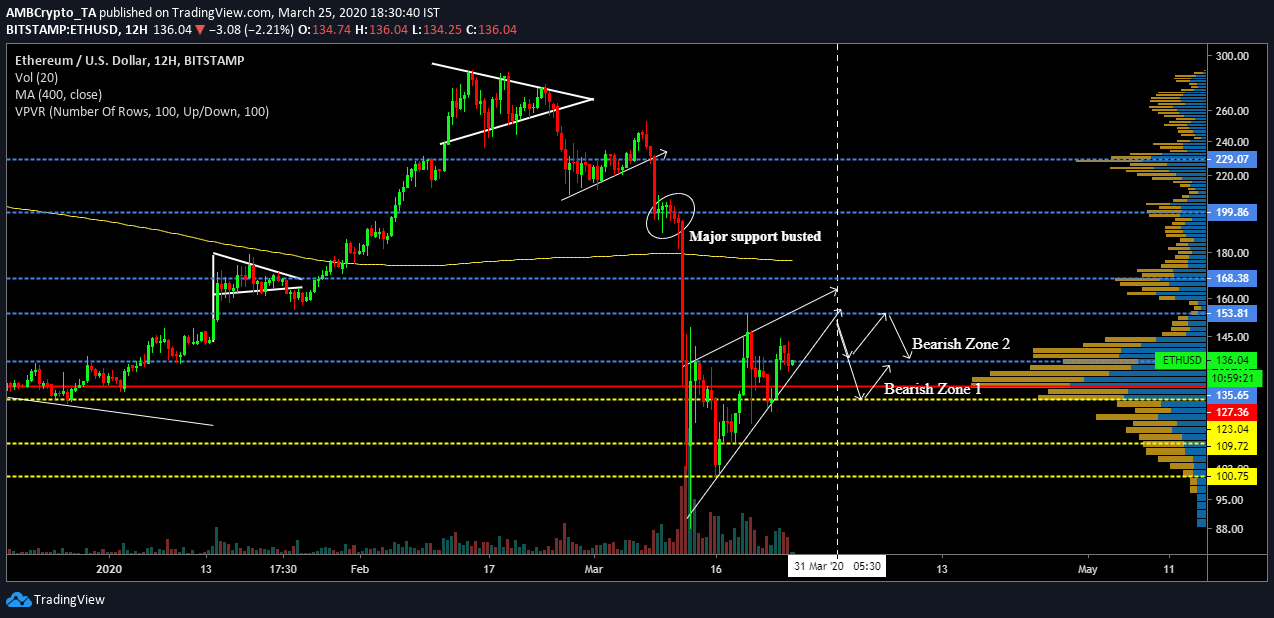
Even though Ethereum was valued at $136 at the moment, the largest altcoin has struggled to comfortably consolidate above the resistance in the past 4 days.
After Ethereum busted its major support line at around $200, the collapse of nearly 50 percent pushed ETH below key support levels at $153, $135 and $123 over a period of 2 days. The valuation went as low as $100 but the price has continued to increase over the last 10 days.
On analyzing the chart, Ethereum’s current movement is giving shape to the formation of a rising wedge. It had registered higher highs with the trendline at $135 and $146, and higher lows at $91, $101 and $122.
There is a possibility Ethereum may scale close to $150 over the next week but a possible bearish break from the pattern looms large. Considering ETH continues to consolidate between $135 and $153 over the next week, after briefly touching $153, the coin may exhibit a pull-back to its current price point at $135. The market suggested that sideways movement may surface for Ethereum unless bullish momentum is able to drive the price higher.
However, if the pullback after the breakout is significant, Ethereum could most likely re-test support level at $123 again.
A case of re-testing support at $123 is supported by the VPVR indicator, which is currently exhibiting the highest trading volume in that range since the beginning of 2020.
The Point-of-Control remains at $127, which is a fair re-test zone for Ethereum, after the bearish breakout surfaces.
High Correlation with Bitcoin
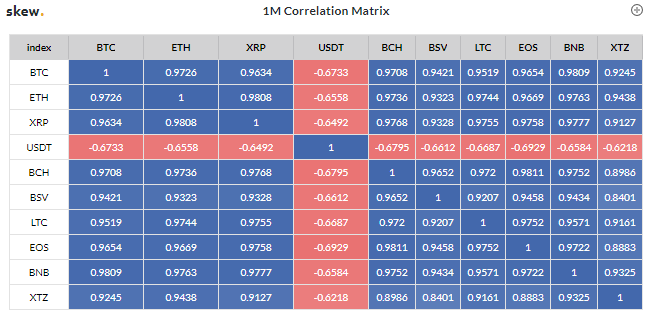
Source: Skew
Bitcoin currently held a correlation factor of 0.97 with Ethereum. Factoring in the above correlation, it can be inferred that BTC’s price could play a large part in the coin’s trajectory.