
As seen in the chart attached below, the exchange token FTT by FTX exchange is performing far better than the altcoin king, ETH, and Synthetix token. However, following FTT is Ethereum, with its relative performance at 2.55% while SNX continues to lag behind both of these by 46%.
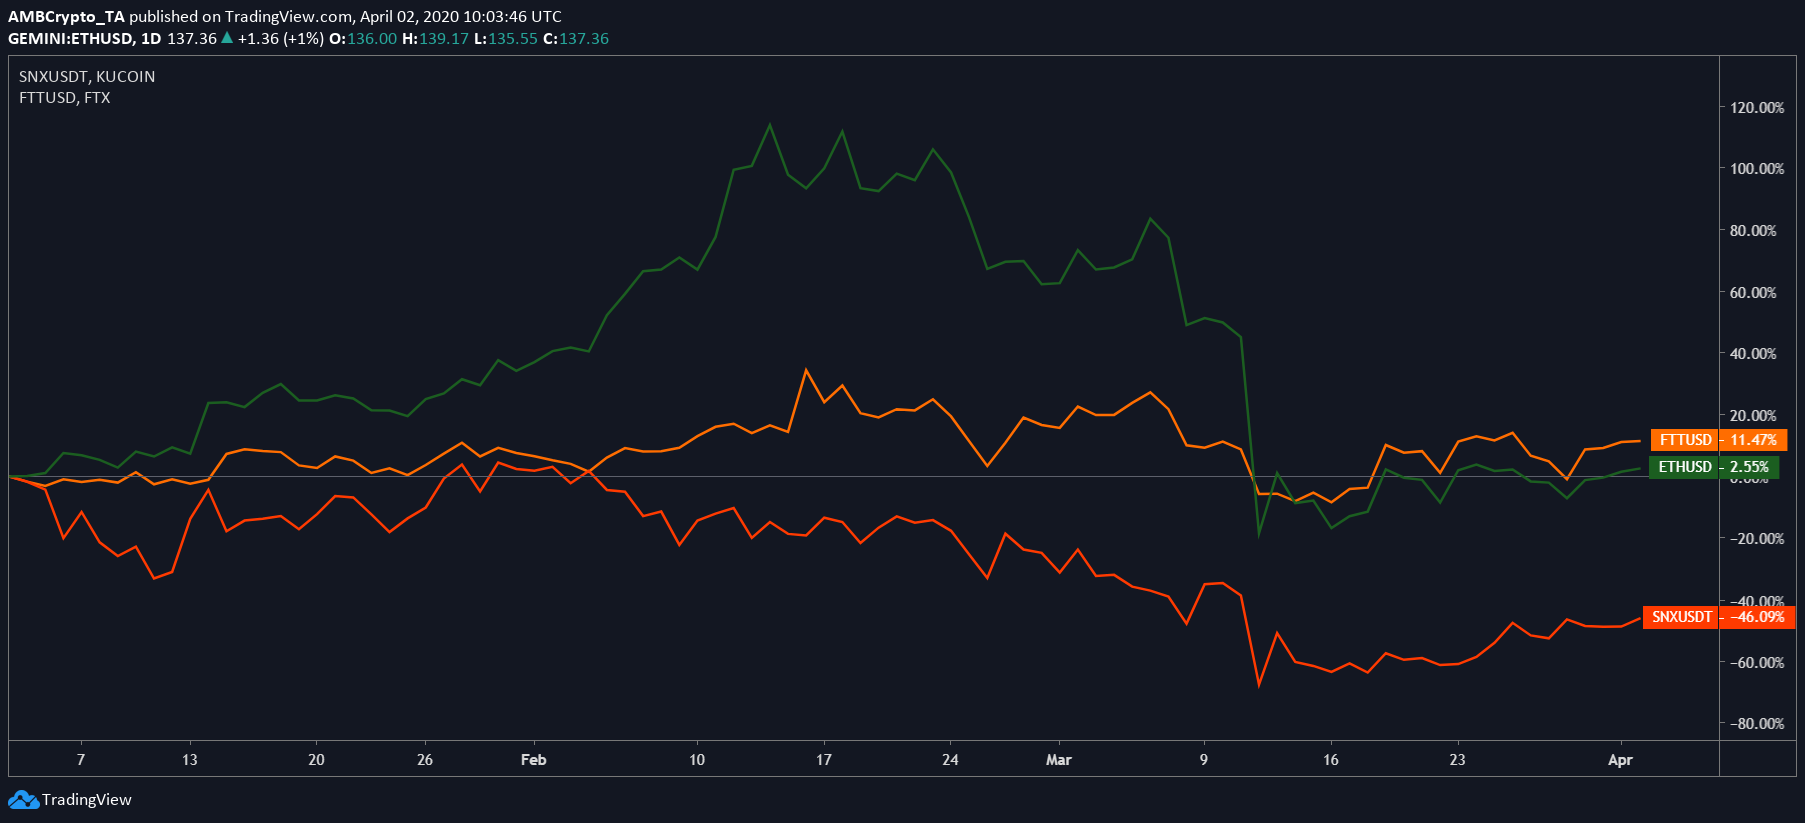
Source: TradingView
Synthetix
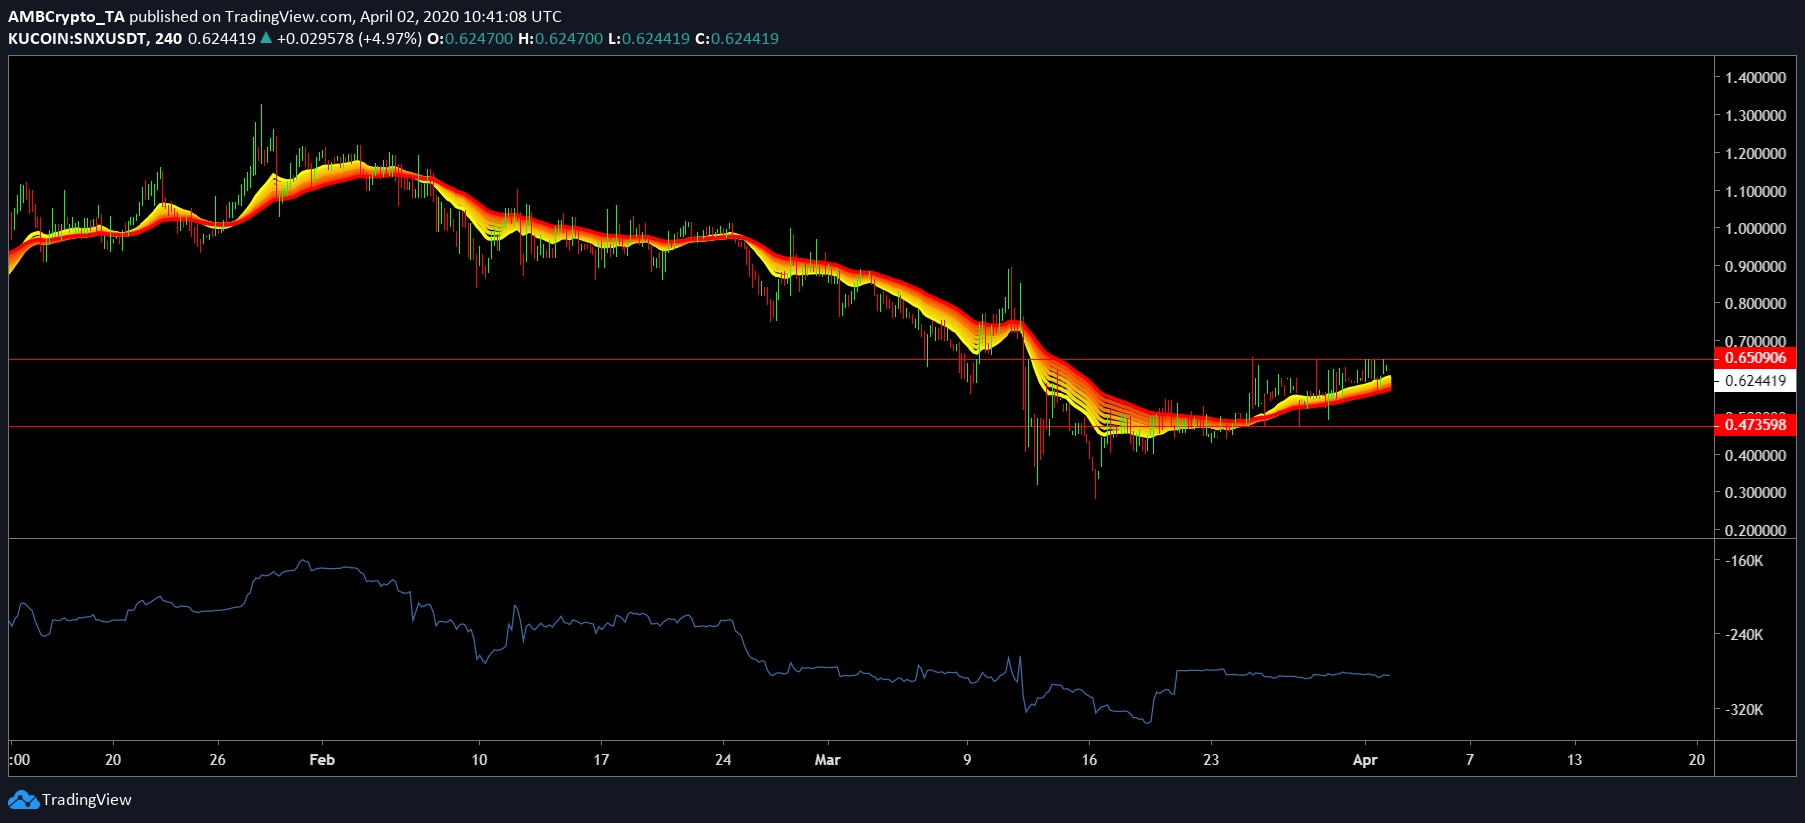
Synthetix token was ranked 45th with a market cap of $110 million and a trading volume of $1.4 million. Although its performance has been terrible over the last 90 days, things may be looking good for the token, with its price surging above the EMA ribbon. Further, the price had already hit a resistance target of $0.65 and it seemed like it might head down if the token breaches the EMA ribbon.
FTX Token
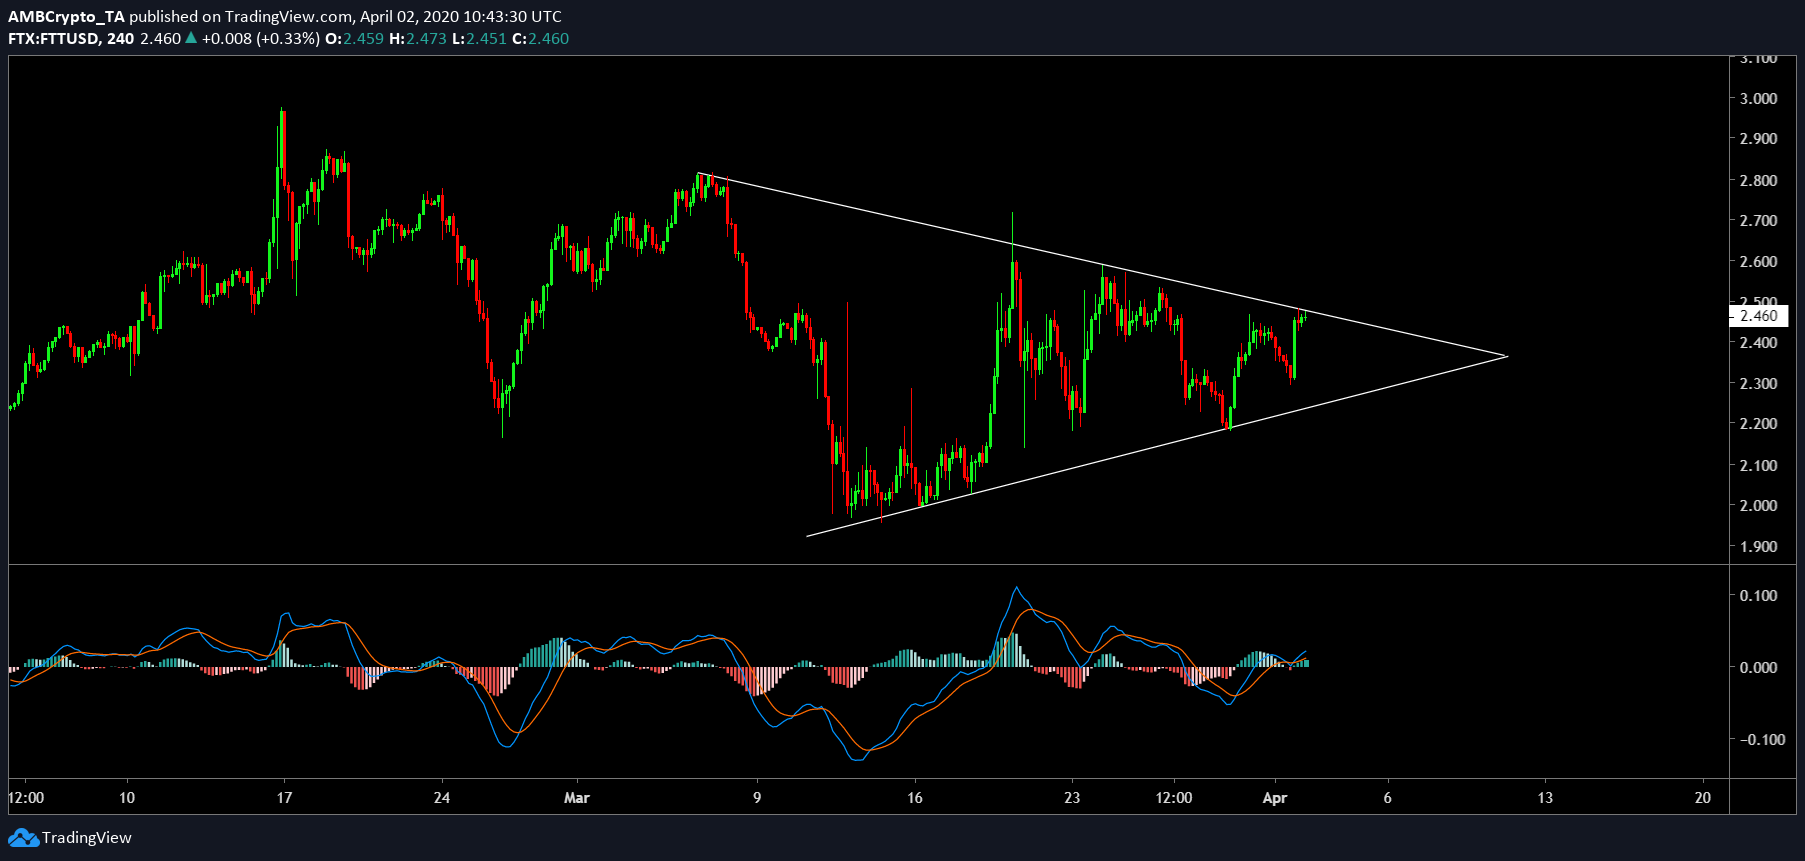
Source: FTTUSD TradingView
It has been a tricky time for FTX, FTX token’s native exchange. Following a recent partnership with FTX, Binance had delisted all FTX leveraged tokens. In response, FTX had revealed that Binance does not want to support leveraged tokens because they “are complicated products, and Binance doesn’t want to manage the user education and customer support for them.”
However, its effects on the token were still unclear as FTX exchange’s FTT token has been forming a large symmetrical triangle since early-March 2020, and the price [$2.46] was nearing the breakout zone. With a market cap of $235 million, the token was the 32nd largest token on CoinMarketCap, with a 24-hour trading volume of $2.8 million.
The MACD indicator showed a bullish crossover in play; however, the price might tumble considering the sloping resistance.
Ethereum
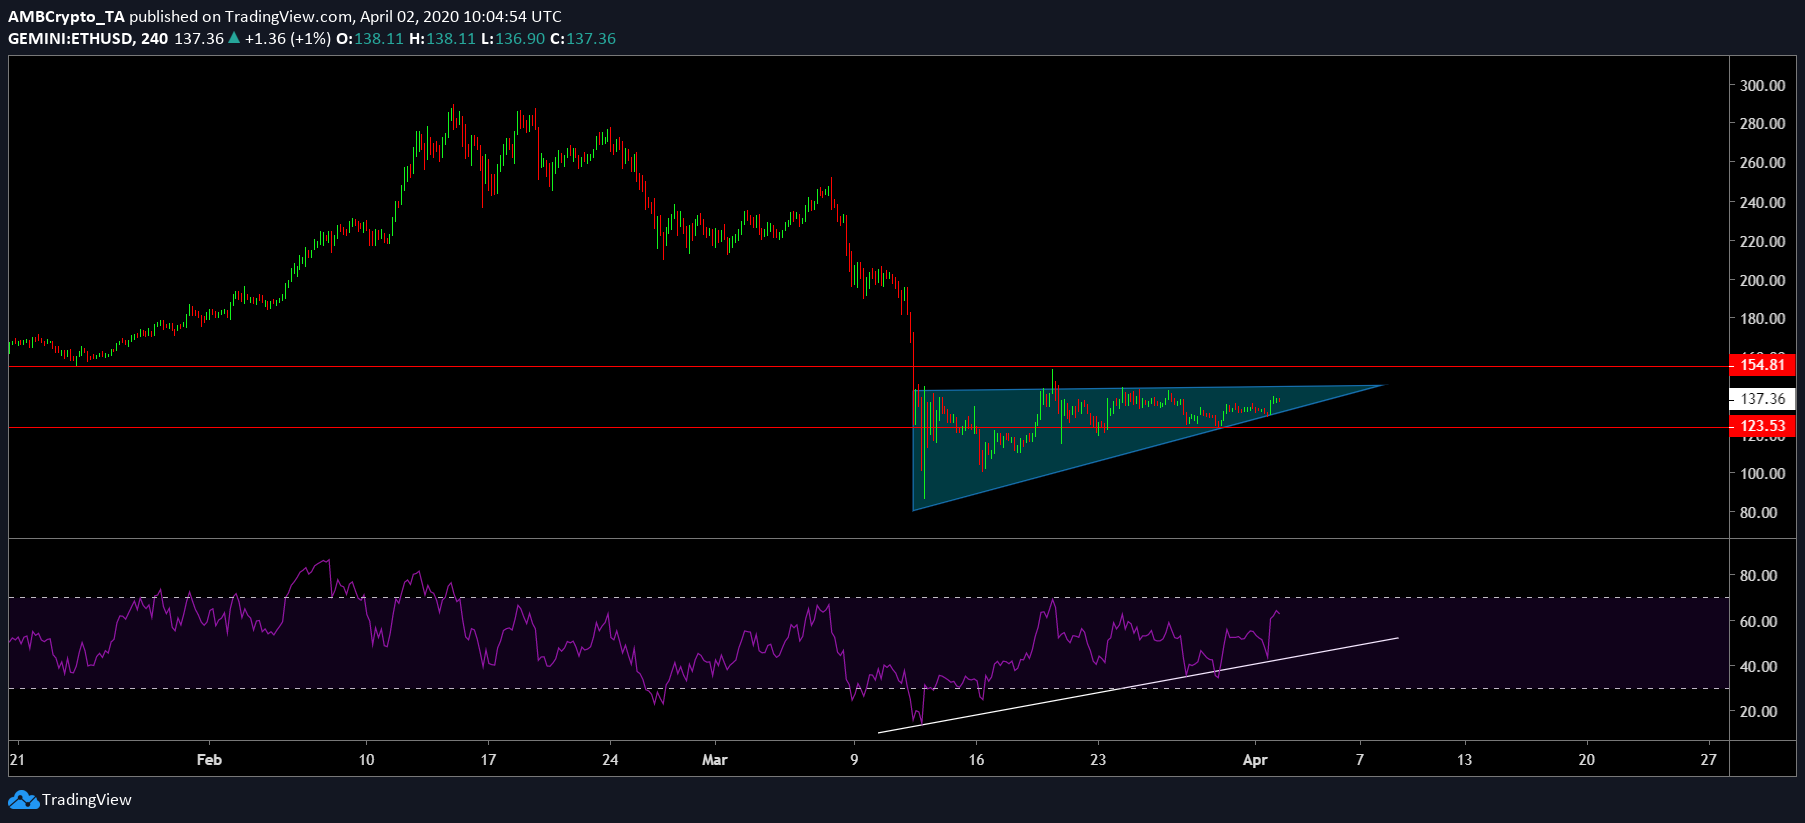
Source: ETHUSD TradingView
The king of altcoins and the most traded altcoin in the market had a 24-hour trading volume of $13 billion and recorded a 4% rise over the last 24 hours. The ascending triangle was still in play, with the price hoping for an upward breakout; especially since the RSI also indicated a healthy surge with the RSI almost hitting the oversold zone.