Ethereum is consolidating gains above the $170 and $165 support levels against the US Dollar. ETH price is likely setting up for another leg higher over the $175 resistance area.Ethereum is showing a few positive signs above the $170 support level.The price could gain bullish momentum once it clears the $175 resistance area.There is a major contracting triangle forming with resistance near $174 on the hourly chart of ETH/USD (data feed via Kraken).The pair could either surge above the $175 barrier or it might correct towards the $162 support.Ethereum Price Eyeing Upside BreakAfter retesting the $175 resistance, Ethereum corrected a few points against the US Dollar. ETH traded below the $170 level, but it remained stable above the $168 level.It seems like the $165 level acted as a support and them price is still well above the 100 hourly simple moving average. The recent high is formed near $173 and the price is currently consolidating gains.It corrected below the 23.6% Fib retracement level of the recent wave from the $165 swing low to $173 high. However, there is a strong support forming near the $170 level.The 50% Fib retracement level of the recent wave from the $165 swing low to $173 high is also near the $170 level. At the outset, there is a major contracting triangle forming with resistance near $174 on the hourly chart of ETH/USD.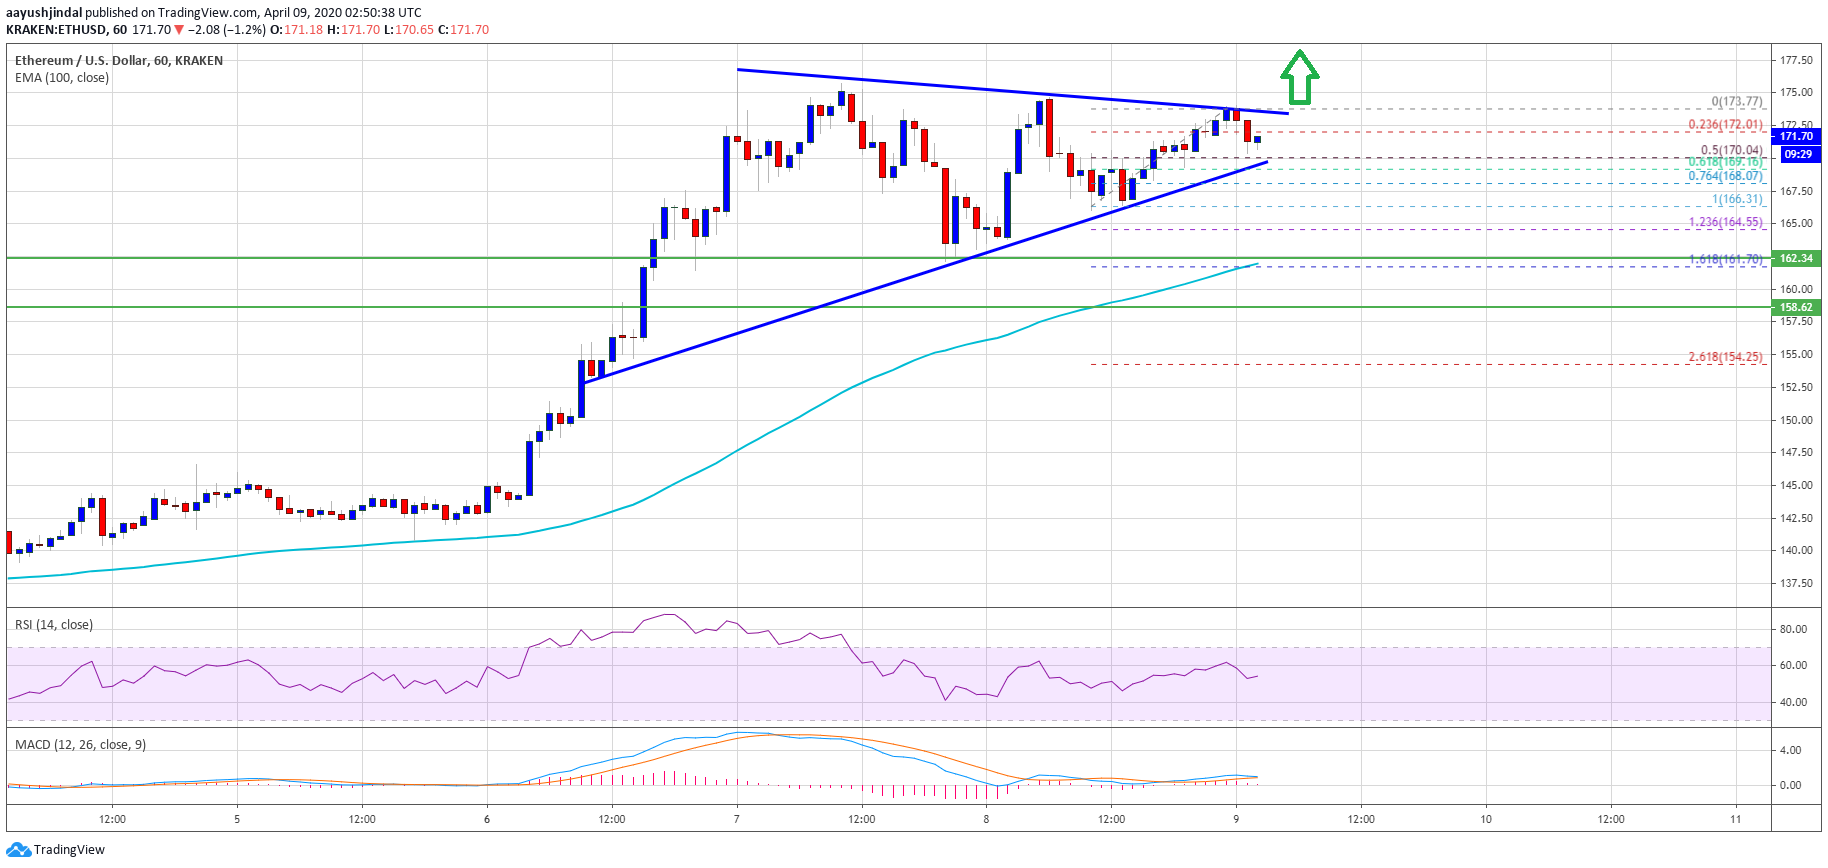 Ethereum PriceIf Ethereum climbs above the triangle resistance, it could start another leg higher over $175. An immediate resistance is near the $180 level, above which the bulls are likely to aim a larger upward move towards the $195 and $200 resistance levels.Dips Remain SupportedOn the downside, an initial support for Ethereum is near the $170 level and the triangle lower trend line. A successful close below the triangle support may perhaps start a bearish wave below $168.The next support is near the $165 level, below which the bears are likely to aim a test of the $162 support area. The 100 hourly simple moving average is also near the $162 level to act as a strong support in the near term. Any further losses could lead the price towards the $158 support.Technical IndicatorsHourly MACD – The MACD for ETH/USD is showing positive signs in the bullish zone.Hourly RSI – The RSI for ETH/USD is currently just above the 50 level.Major Support Level – $165Major Resistance Level – $175Take advantage of the trading opportunities with Plus500Risk disclaimer: 76.4% of retail CFD accounts lose money.
Ethereum Watch
ETHEREUM and ICO TOKENS
