
The largest altcoin, Ethereum, soared by 4.38% over the last 24-hours which pulled the coin to a valuation of $179.89, at press time. Despite the bullish revival, ETH bulls have lacked the necessary strength to attempt a crucial breach to the upside.
Ethereum [ETH] Daily Chart:
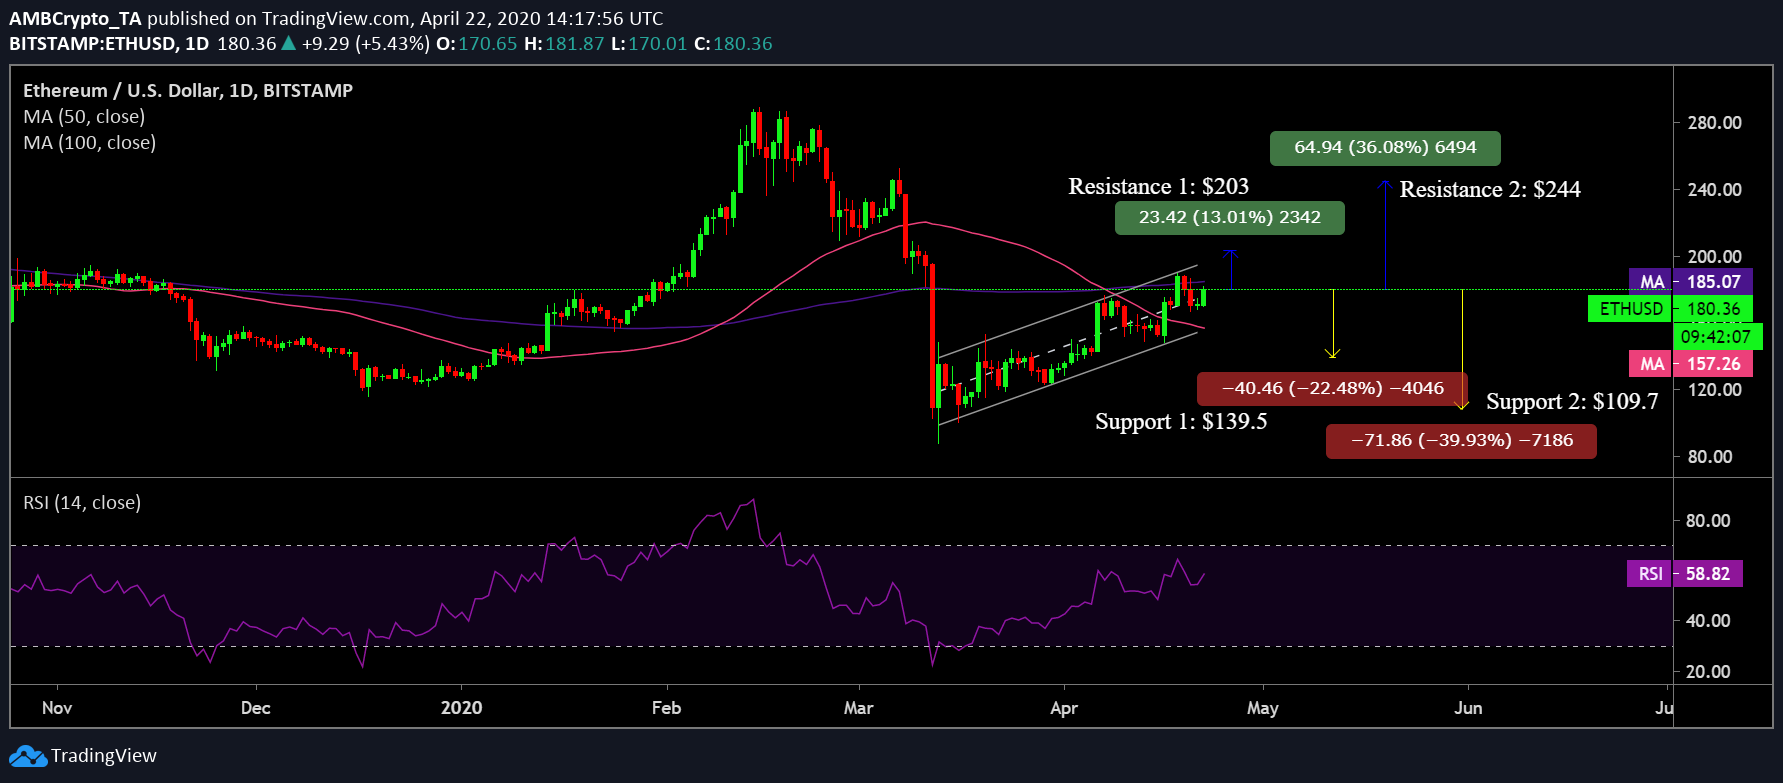
Ascending channel formation on the Ethereum’s daily chart depicted the rising price over time right after the 12th March crash. It took 40 days for the pattern to take shape and despite a minor rally on 6th April, the price had failed to breach the above trendline as it continued oscillating between the two bands.
Moving Averages align with the bears
The 50 DMA and the 200 DMA underwent a golden cross on the 9th of February as the crypto market went on a significant rally. However, this was cut short on the fateful day of 12th March. In the case of ETH, moving averages subsequently converged following which the 50 DMA went below the 200 to exhibit a death cross on 7th April, despite a surge the previous day.
The daily moving averages appeared to be still very much in the bearish territory as the gauge between the moving averages did not show any signs reducing, rather its rising divergence pointed towards the high bearish pressure weighing down on the coin.
The rising RSI depicted a positive picture. The RSI indicator was well above the 50-median line and depicted a sentiment of high buying pressure in the Ethereum market.
Scenario 1:
If the bearish breakout plays out, ETH could retest its support close to the 2020-low at $139.5, and if the trend persists, the coin could further drop to $109.7-level.
Scenario 2:
In case of a trend reversal, and if ETH successfully breaches resistance by the 50 DMA, its price could be resisted at $203. Another substantial resistance point for the coin stood firm at $245, a level unseen since 7th March.
Correlation:
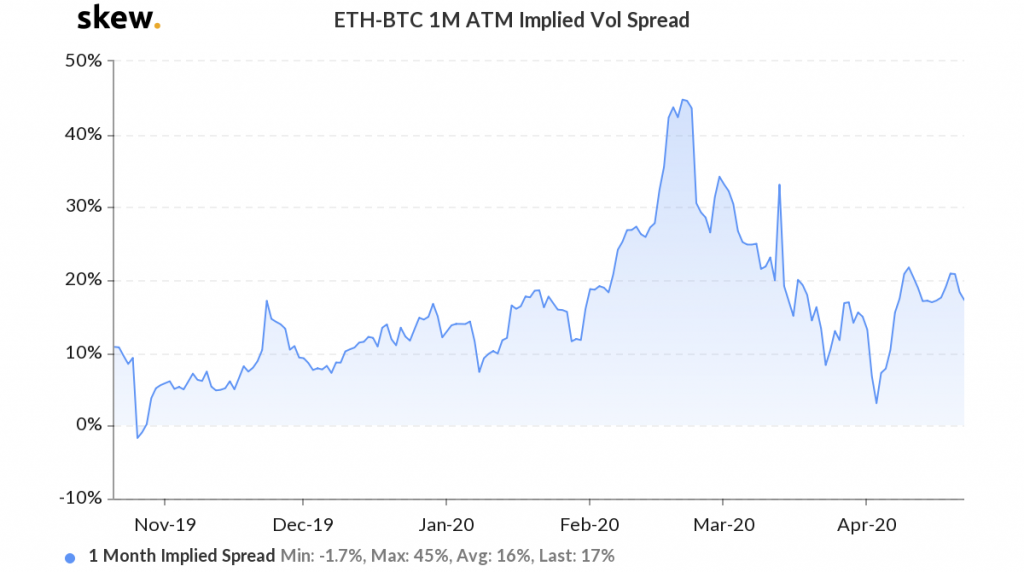
Source: Skew
As observed in the above chart, over the past two weeks, ETH-BTC 1 month implied volatility has improved after registering a 4-month low on 3rd April. The increase in implied volatility spread indicates that Ethereum has facilitated a steady decoupling from Bitcoin over the past few days.
Conclusion:
In case of a bearish breakout retracement points include $139.5 and $109.7. However, in an unlikely scenario of a breakout to the positive side, the coin could be resisted at points $203 and $245.