The largest altcoin, Ethereum had reclaimed its territory above $200 after dropping beneath the mark a couple of days earlier following a minor pullback. ETH had a bullish case in the first quarter of 2020, as it was down by 25% since the yearly high.
Ethereum 4-Hour Chart:
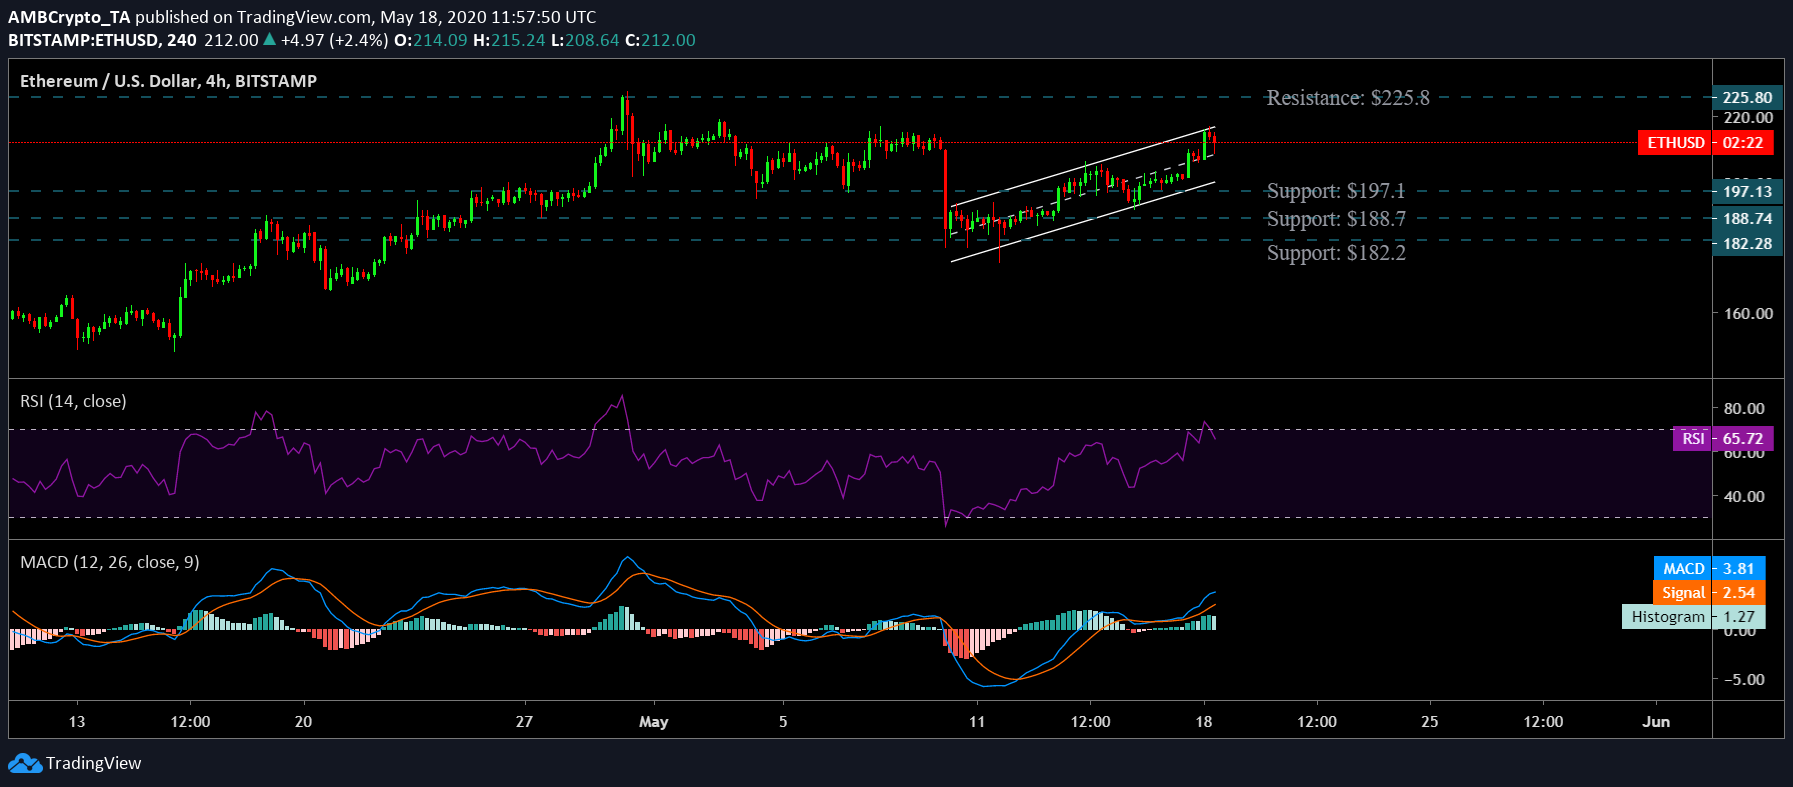
Ethereum’s price has been following a consistent upward trend leading up to the formation of an ascending channel pattern. A breakout of this pattern could lead to a bearish phase. However, the placement of the daily moving averages had a different story to tell.
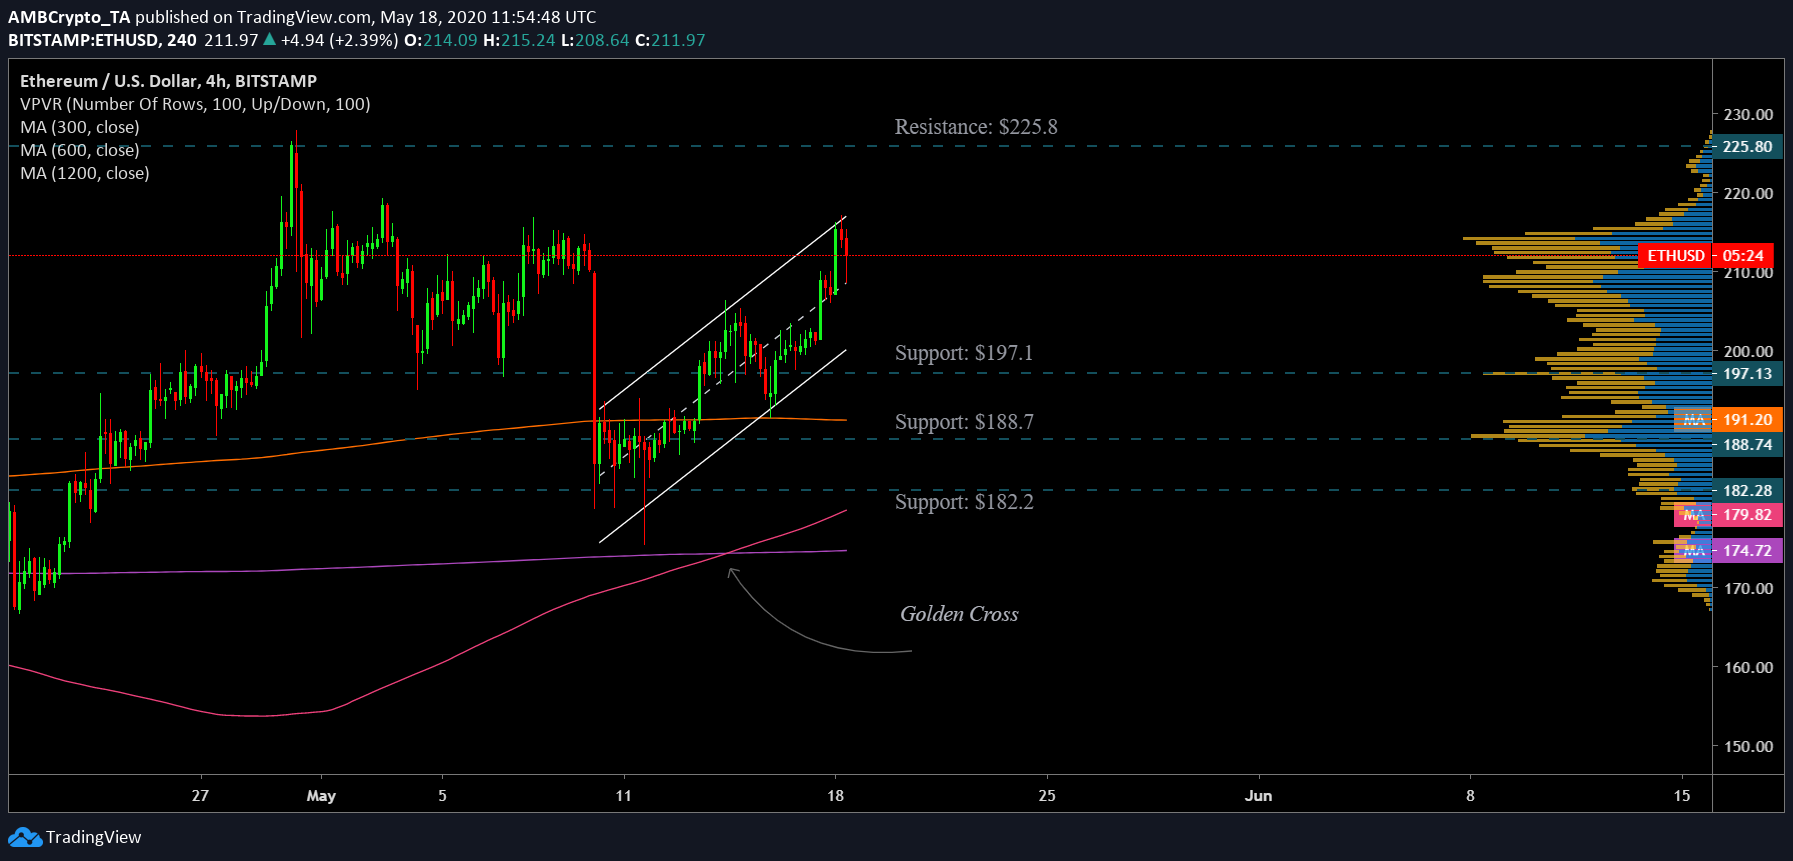
The 50 daily moving average [Pink] underwent a golden cross with the 200 daily moving average [Purple] on the 14th of May. The diverging moving averages pointed towards a bullish phase for the coin in the near-term. In addition, the 100 daily moving average [Orange] also hinted a minor decline while the 50 rose and the gauge between the two declined, meaning a potential bullish crossover could materialize.

Source: ETH/USD on TradingView
Further strengthening for a bullish case was the RSI indicator which was well above the 50 median line indicating a positive buying sentiment among the traders in the market. The MACD indicators also aligned with the bulls as the signal line settled below it suggesting a bullish trend for the coin.
Bullish case:
In the case of a bullish breakout, which is supported by the placement of the DMAs as well as the indicators- RSI and MACD, ETH could climb all the way to $225, a level unseen since 30th April.
Bearish case
A breakout to the negative side seems bleak. However, in an unlikely scenario of a bearish breakout, the coin can find support at points $197.1, $188.71 and $182, levels where the VPVR indicator depicted huge trading activity.
Correlation:

Source: Skew
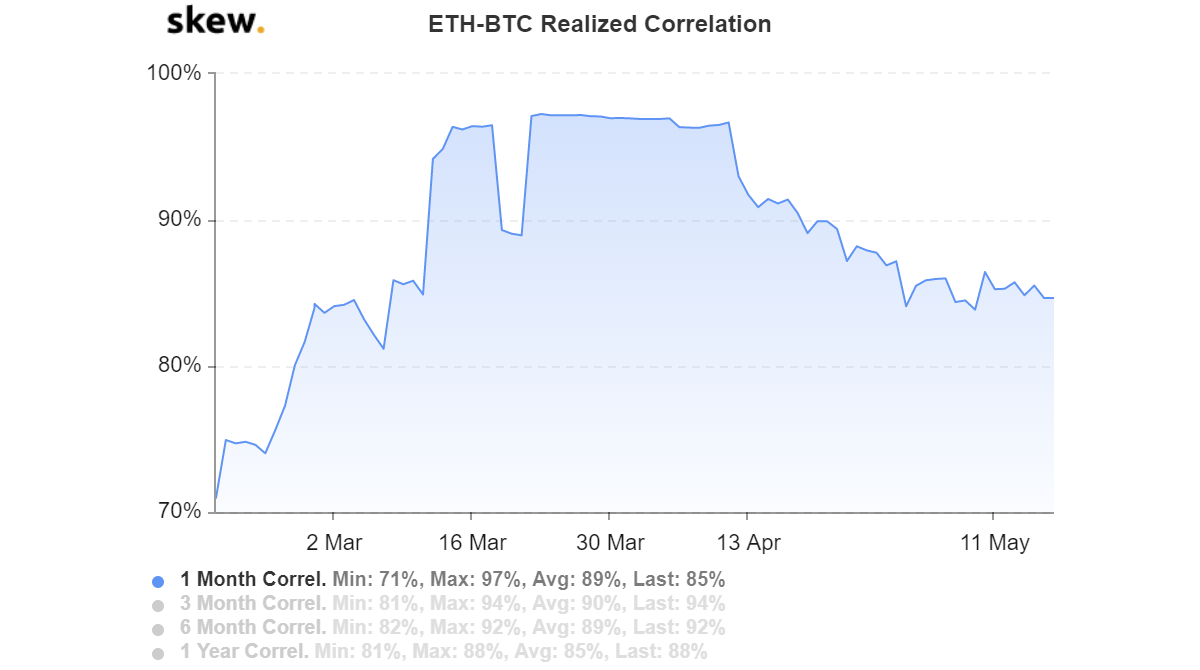
Historically, ETH has closely mirrored the price action of Bitcoin. While the correlation has dropped, the king coin has still managed to sway the alt during times of both surges as well as pullbacks, meaning Bitcoin’s rally would propel Ethereum to breach significant level and recover for the loses that were wiped following the crash.
Conclusion:
The above indices pointed towards a bullish breakout that could catapult the coin all the way to the $225-resistance level. The support points for the coin stood at $197.1, $188.7, and $182.2.

