
Ethereum is struggling to clear the $230 resistance level against the US Dollar. ETH price is showing positive signs and it seems like a close above the 100 SMA (H4) could trigger a fresh rally.
- ETH price is slowly moving higher towards the $230 resistance against the US Dollar.
- A close above the 100 simple moving average (4-hours) could spark a strong upward move.
- There was a break above an important bearish trend line with resistance near $225 on the 4-hours chart of ETH/USD (data feed via Kraken).
- The pair could dip a few points, but it is likely to make another attempt to clear the $230 resistance.
Ethereum Price Testing 100 SMA (H4)
After a strong rejection near $250, Ethereum started a major decline below the $238 support against the US Dollar. ETH price traded below the $230 support level and settled well below the 100 simple moving average (4-hours).
The decline was such that the price even spiked below $220. A low was formed near $216 before the price started an upside correction. There was a break above the $220 level, plus the 23.6% Fib retracement level of the downward move from the $250 swing high to $215 low.
The upward move was capped by the $232 resistance. It represents the 50% Fib retracement level of the downward move from the $250 swing high to $215 low. The price is currently trading above the $225 support, but it is struggling to gain momentum above the 100 simple moving average (4-hours).
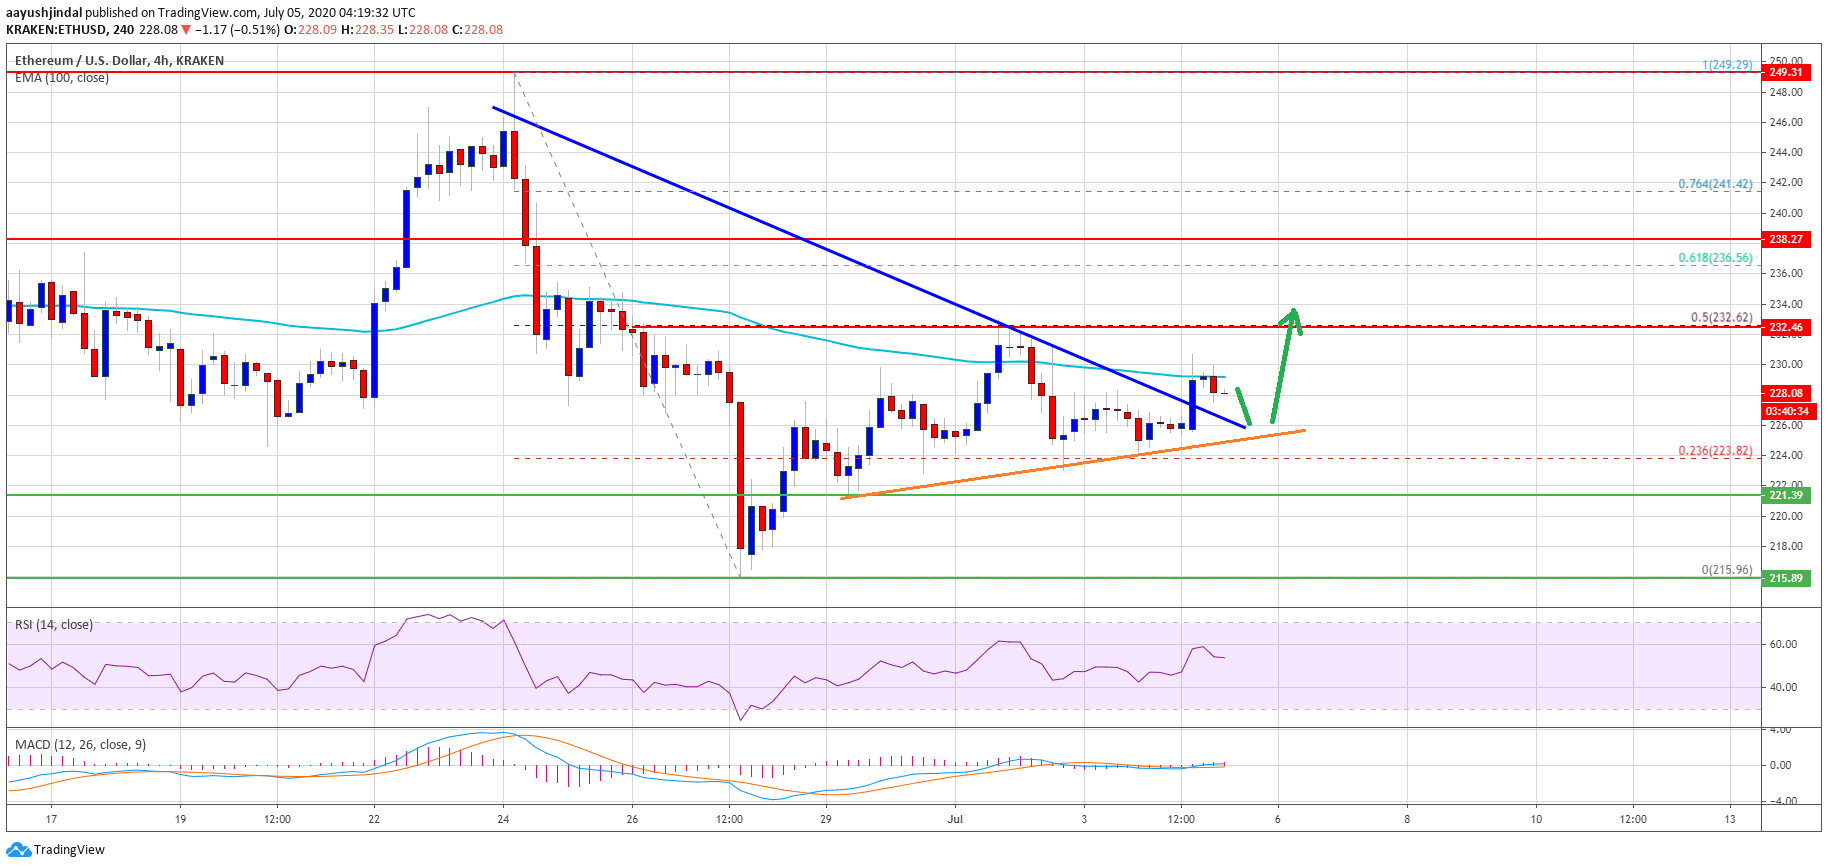
Ethereum price testing $230. Source: TradingView.com
Recently, there was a break above an important bearish trend line with resistance near $225 on the 4-hours chart of ETH/USD. This is a positive sign, but the bulls still need to push the price above the 100 SMA and $230.
If there is a successful close above $230 and $232, the price could start a strong increase in the coming sessions. The next target for the bulls could be $250.
Fresh Decline in ETH?
If Ethereum fails to continue higher above the $230 and $232 resistance levels, there are chances of a fresh decline. An initial support is near the $222 level.
A daily close below the $222 support zone could start a steady decrease. The next support is near $215, below which the bears might aim a test of $200.
Technical Indicators
4 hours MACD – The MACD for ETH/USD is losing momentum in the bullish zone.
4 hours RSI – The RSI for ETH/USD is currently correcting lower towards the 50 level.
Major Support Level – $222
Major Resistance Level – $232
Take advantage of the trading opportunities with Plus500
Risk disclaimer: 76.4% of retail CFD accounts lose money.