
Ethereum declined below $500 before the bulls appeared near $480 against the US Dollar. ETH price is correcting higher, but it is likely to face a strong resistance near $550 and the 100 hourly SMA.
- Ethereum started an upside correction after forming a strong support at $480.
- The price is facing a strong resistance near $550 and the 100 hourly simple moving average.
- There is a short-term contracting triangle forming with resistance near $528 on the hourly chart of ETH/USD (data feed via Kraken).
- The pair could test the $550 resistance if it clears the triangle resistance zone.
Ethereum Price is Facing Hurdles
Yesterday, we saw a sharp decline in bitcoin, Ethereum, ripple and other altcoins. ETH even broke the $550 support level and settled well below the 100 hourly simple moving average.
It opened the doors for more downsides and the price even spiked below $500. Finally, ether found support near the $480 level. The bears made two attempts to clear the $480 support, but they failed. The price started a decent recovery wave above the $500 level.
There was a break above the $510 resistance level. Ether even climbed above the 23.6% Fib retracement level of the recent decline from the $623 swing high to $478 low.
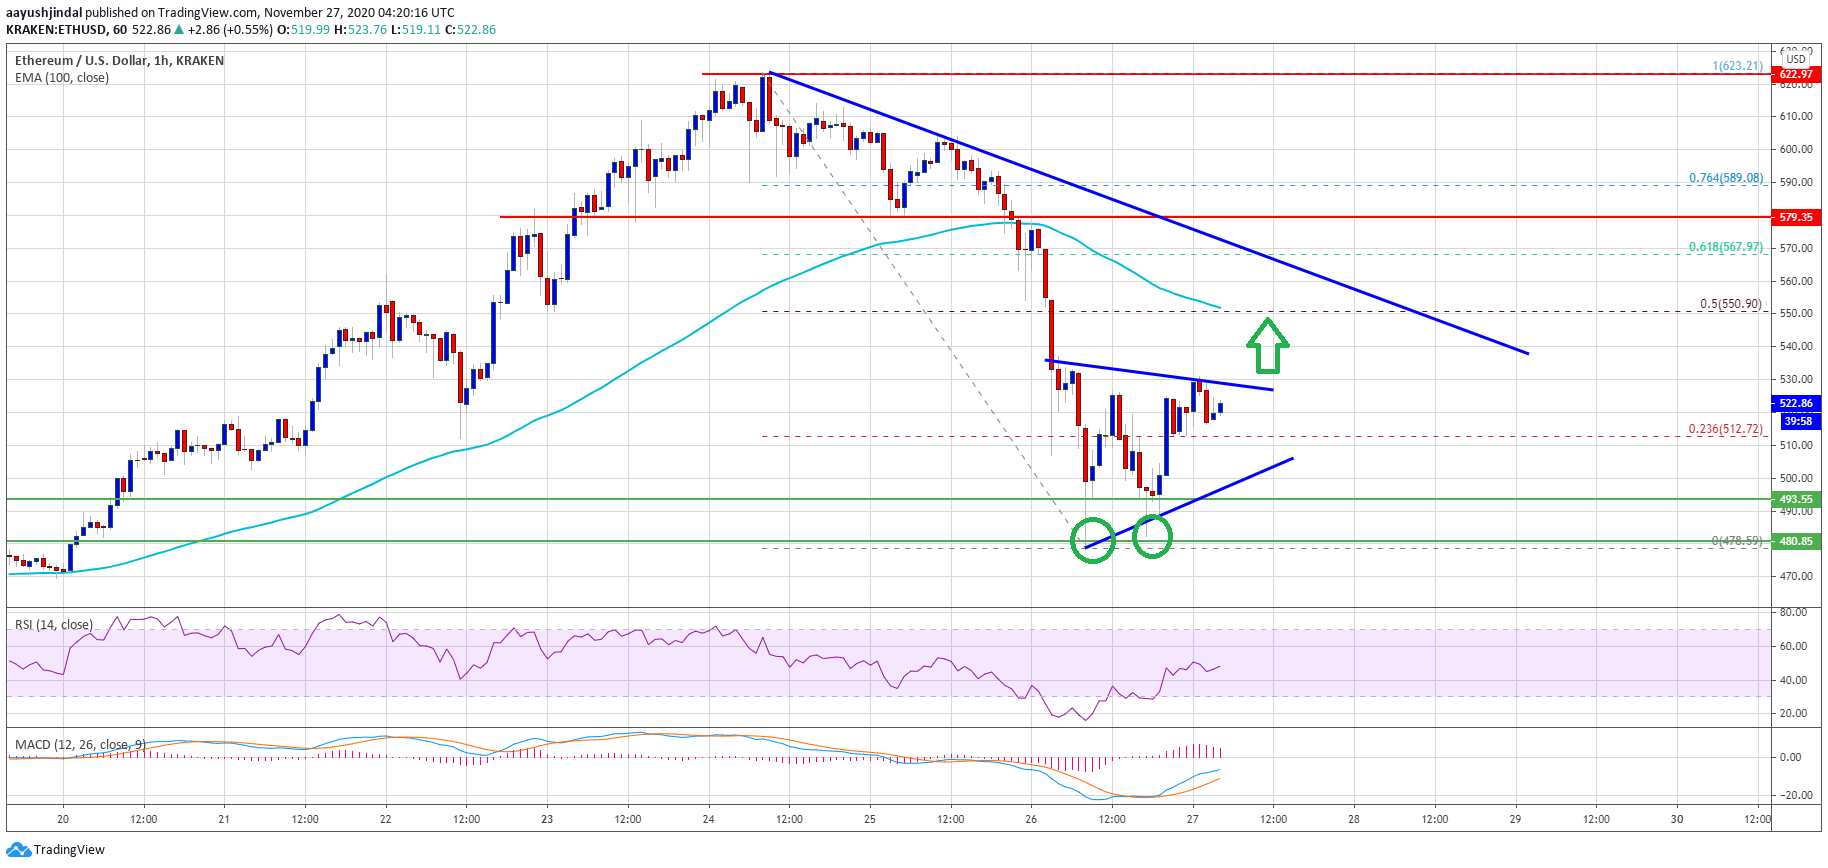
Source: ETHUSD on TradingView.com
On the upside, there is a major hurdle forming near the $550 level and the 100 hourly simple moving average. There is also a short-term contracting triangle forming with resistance near $528 on the hourly chart of ETH/USD.
If there is an upside break above the triangle resistance, the price could test the $550 barrier. It is also close to the 50% Fib retracement level of the recent decline from the $623 swing high to $478 low. To move back into a positive zone, the price must clear the $550 resistance and settle above the 100 hourly SMA.
More Losses in ETH?
If ethereum fails to recover above the triangle resistance or $550, there could be a fresh decline. An initial support is near the $510 level and the triangle lower trend line.
A downside break below the triangle support could push the price below the $500 level. The main support is near the $480 level, below which there is a risk of a drop towards the $450 level.
Technical Indicators
Hourly MACD – The MACD for ETH/USD is slowly losing momentum in the bullish zone.
Hourly RSI – The RSI for ETH/USD is currently close to the 50 level.
Major Support Level – $510
Major Resistance Level – $550