
Ethereum gained bullish momentum and broke the $550 resistance against the US Dollar. ETH price is up over 8% and it seems like the bulls are aiming $600 or $620.
- Ethereum started a fresh increase after it broke the $530 resistance level.
- The price surpassed a major hurdle at $550 and the 100 hourly simple moving average.
- There was a break above a key bearish trend line with resistance near $540 on the hourly chart of ETH/USD (data feed via Kraken).
- The pair is trading in a positive zone and it could higher towards $600 or $620.
Ethereum Price is Up 8%
In the weekly analysis, we discussed the importance of the $550 resistance for Ethereum. ETH price started following a steady bullish path, and surpassed many hurdles near the $540 and $550 levels.
Bitcoin price also gained traction above $18,200, helping ether to clear the $550 resistance. There was also a break above a key bearish trend line with resistance near $540 on the hourly chart of ETH/USD. There was also a break above the 50% Fib retracement level of the key decline from the $623 swing high to $478 low.
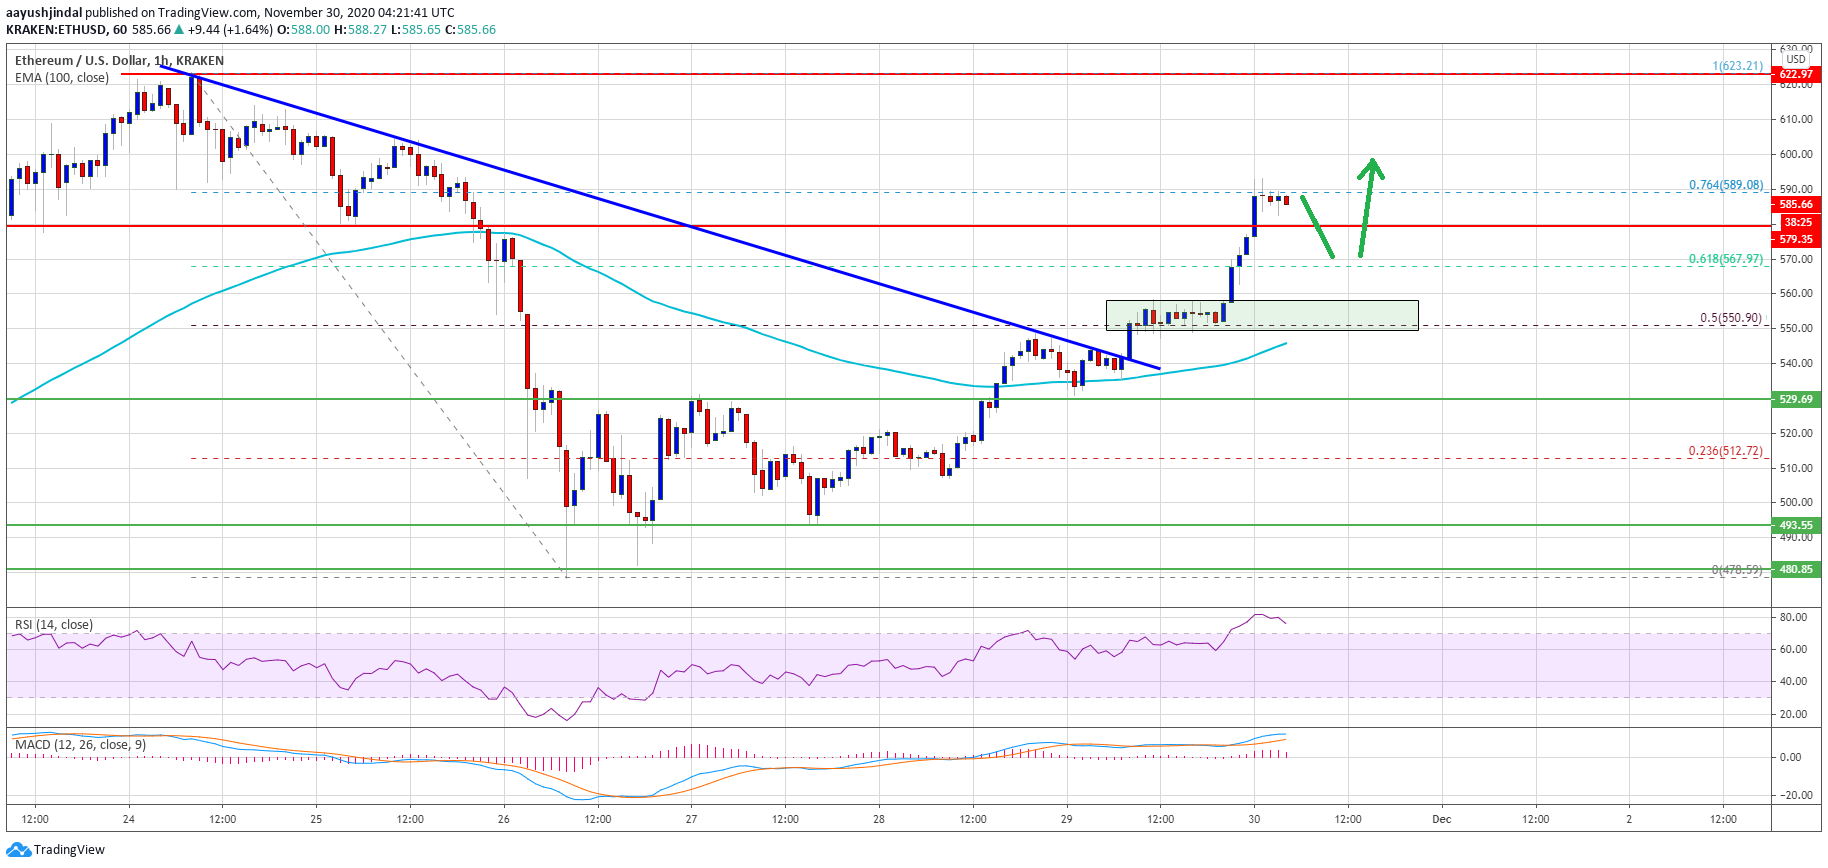
Source: ETHUSD on TradingView.com
The pair settled nicely above the $565 level and the 100 hourly simple moving average. Ether tested the $590 resistance level. It seems like the bears are protecting the 76.4% Fib retracement level of the key decline from the $623 swing high to $478 low.
A clear break above the $590 level could open the doors for more gains above $600. In the stated case, the price is likely to revisit the $620 resistance or the $623 swing high in the near term. Any further gains may possibly push the price towards the $650 level.
Dips Supported in ETH?
If ethereum fails to clear the $590 resistance level, there could be a minor downside correction. An initial support is near the $580 level (a multi-touch zone).
A downside break below the $580 level might call for an extended decline. The next major support is near the $560 and $550 levels, followed by the key 100 hourly simple moving average. Any further losses could lead ether towards the $530 support level.
Technical Indicators
Hourly MACD – The MACD for ETH/USD is slowly losing momentum in the bullish zone.
Hourly RSI – The RSI for ETH/USD is currently well above the 50 level.
Major Support Level – $550
Major Resistance Level – $590