
Ethereum cleared the $600 resistance level and tested the $625 zone against the US Dollar. ETH price is consolidating above $600 and likely setting up for the next move.
- Ethereum settled above the key $600 resistance level and climbed towards $625.
- The price is currently consolidating near the $600 support and the 100 hourly simple moving average.
- There is a major contracting triangle forming with resistance near $620 on the hourly chart of ETH/USD (data feed via Kraken).
- The pair could start a fresh increase above $620 as long as it is above the 100 hourly SMA.
Ethereum Price Resistance Turned Support
There was a steady increase in Ethereum after it broke the $600 resistance. ETH price even broke the $610 level and settled above the 100 hourly simple moving average.
It traded close to the $625 resistance before starting a downside correction. A high was formed near $624 and the price corrected lower below $615. There was a break below the 50% Fib retracement level of the upward move from the $587 swing low to $624 high.
Ether is currently approaching the $600 support zone and trading above the 100 hourly simple moving average. There is also a major contracting triangle forming with resistance near $620 on the hourly chart of ETH/USD.
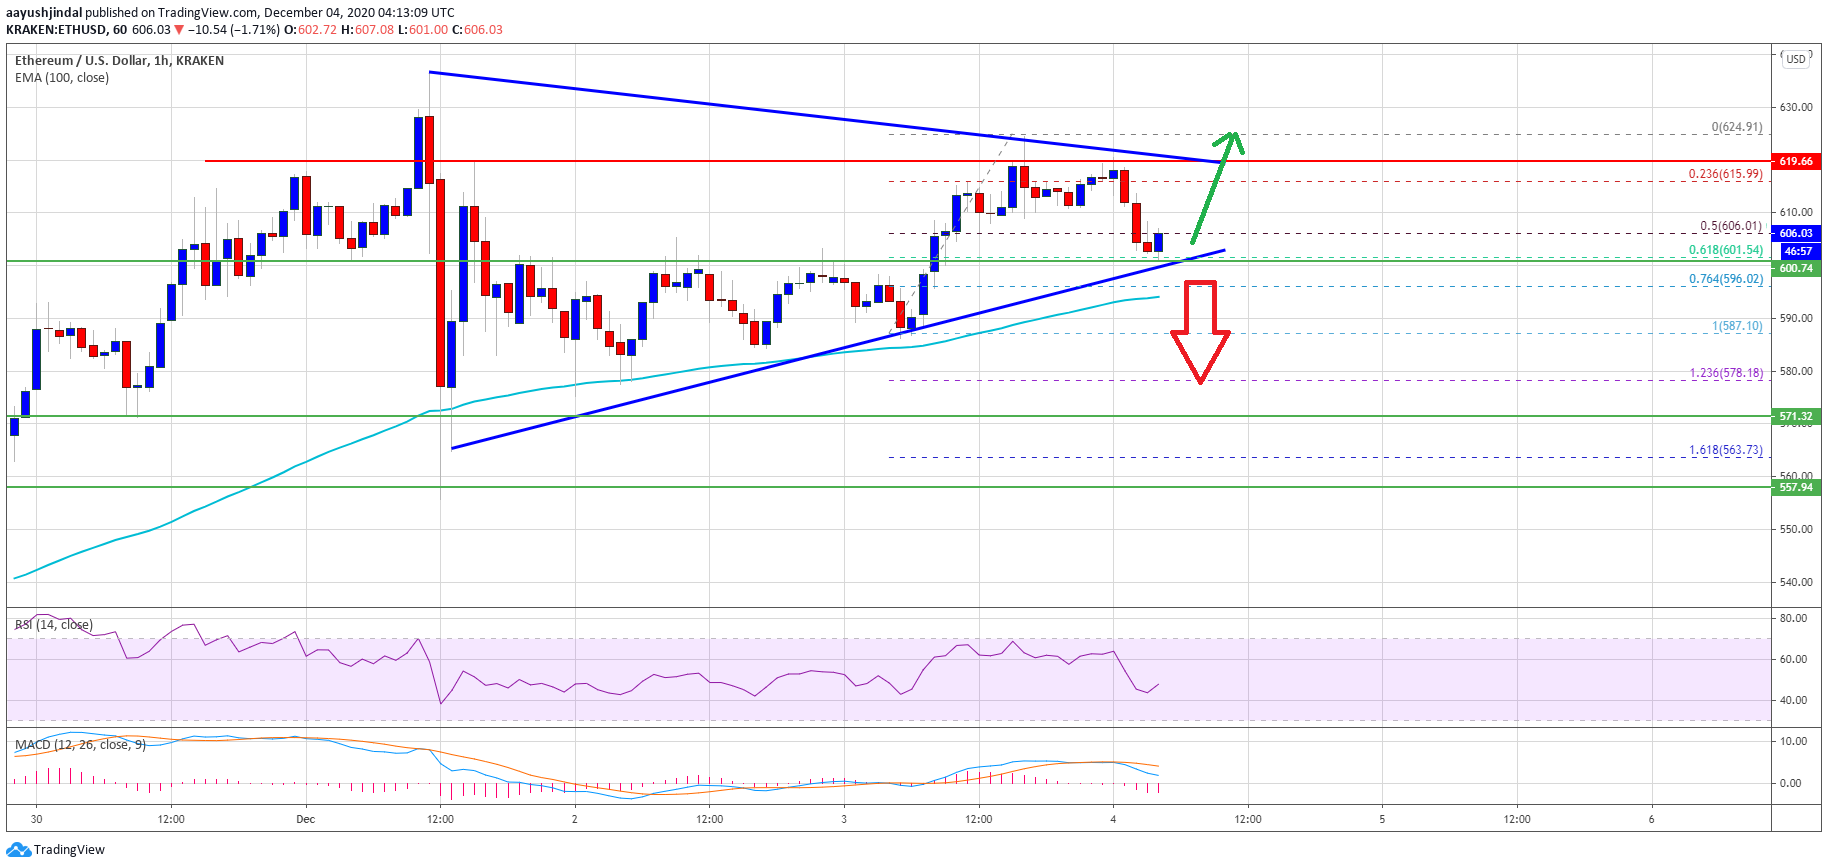
Source: ETHUSD on TradingView.com
The triangle support is close to the 61.8% Fib retracement level of the upward move from the $587 swing low to $624 high. As long as the price is above the $600 support and the 100 hourly simple moving average, it could start a fresh increase.
An initial resistance is near the $615 level. The main resistance is near the $620 level, above which ether price is likely to accelerate higher above $625 and $630.
Downside Break in ETH?
If ethereum fails to clear the $615 resistance and the triangle upper trend line, there is a risk of a downside break. The first key support is near the $600 level and the 100 hourly simple moving average.
A downside break below the $600 support and the 100 hourly SMA could spark a sharp decline. The next major support is near the $570 level, where the bulls are likely to take a stand.
Technical Indicators
Hourly MACD – The MACD for ETH/USD is slowly losing momentum in the bearish zone.
Hourly RSI – The RSI for ETH/USD is currently rising and approaching the 50 level.
Major Support Level – $600
Major Resistance Level – $620