
Disclaimer: The information presented does not constitute financial, investment, trading, or other types of advice and is solely the writer’s opinion
- ETH was in a bearish structure at press time.
- Further plunge could be likely if BTC drops below the $21K zone.
Ethereum [ETH] plunge could extend if the $1,540 support fails to hold. However, additional short-selling opportunities could be availed if such an extended price correction occurs.
Read Ethereum [ETH] Price Prediction 2023-24
In other new developments, Joseph Lubin, Ethereum co-founder and founder of ConsenSys, is reportedly convinced that the U.S. won’t classify Ether as a security. This comes after the U.S. SEC banned Kraken’s staking service in the United States.
Is an extended plunge likely?
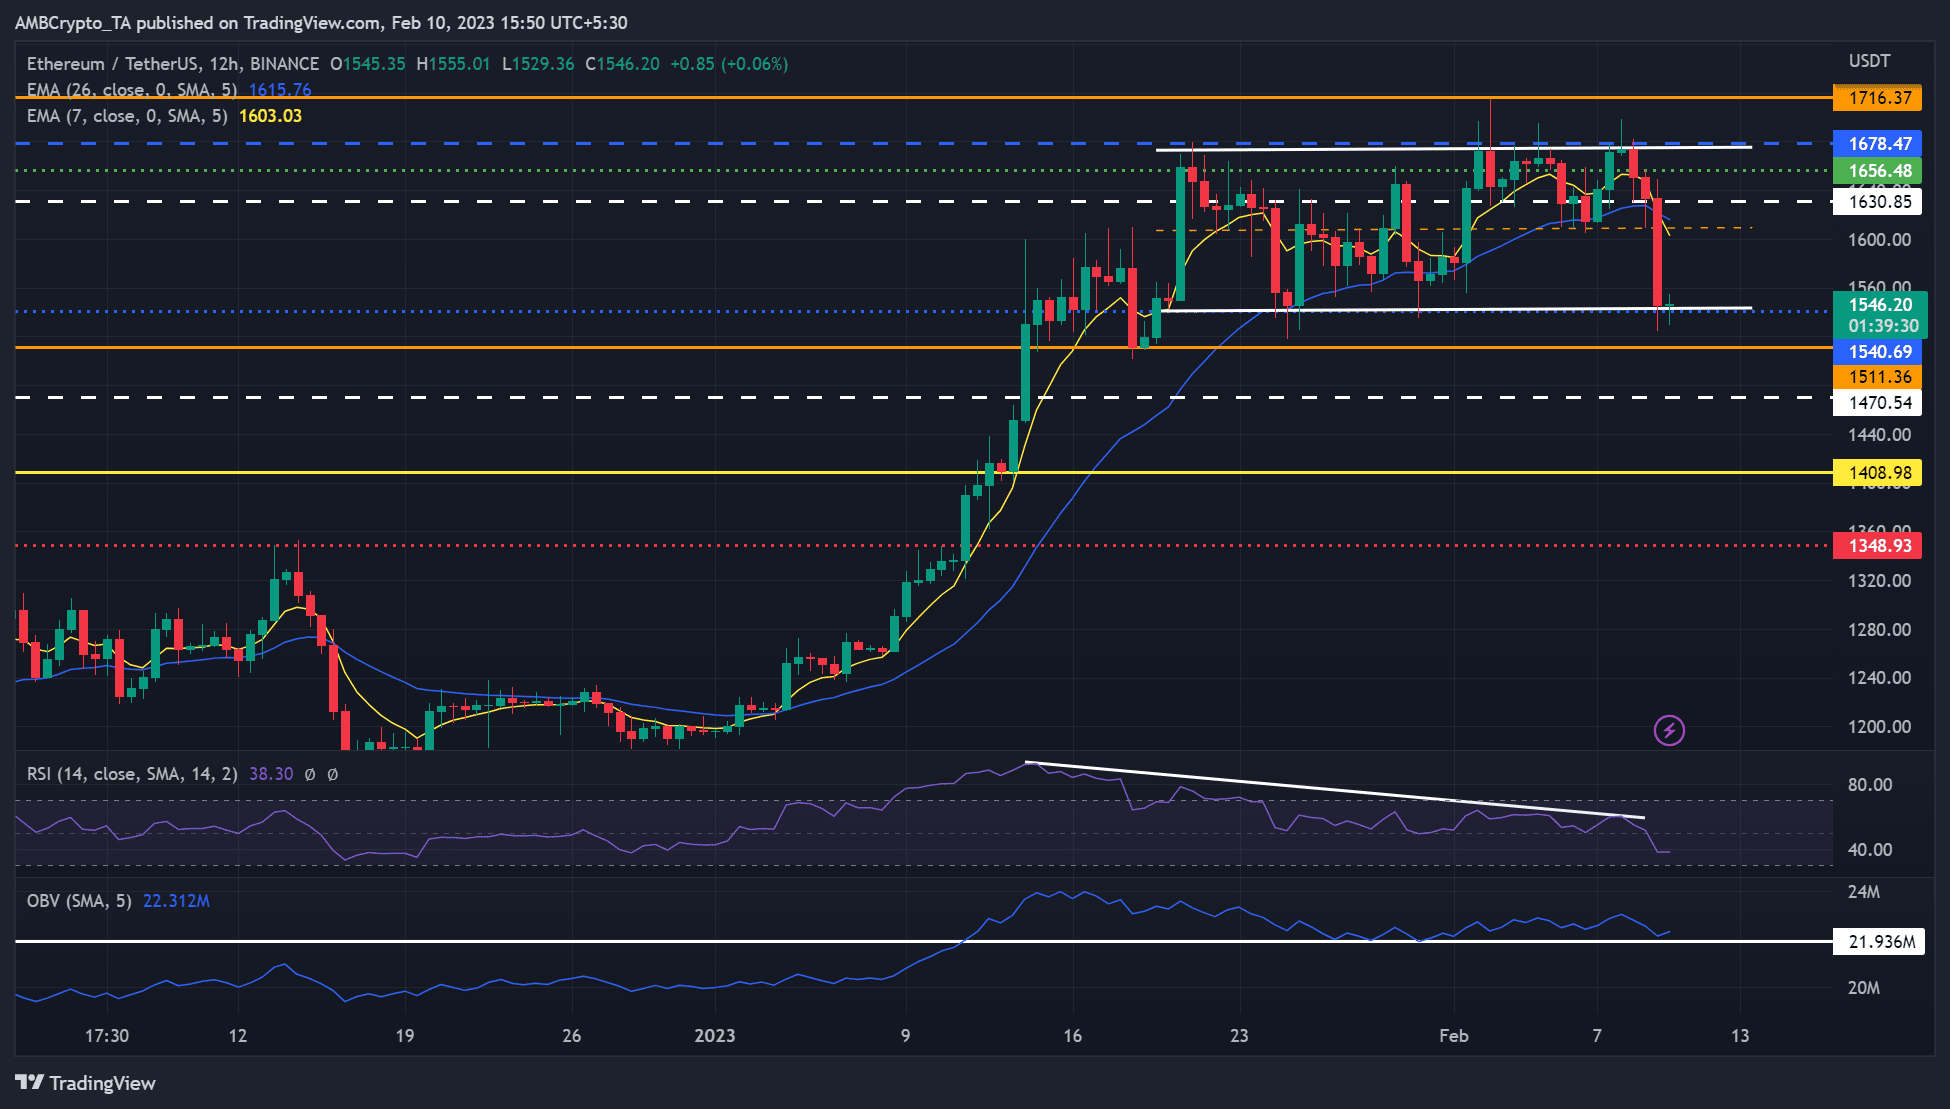
Source: ETH/USDT on TradingView
Since mid-January, ETH fluctuated between $1,540 and $1,678. However, Bitcoin [BTC] lost hold of the $22K zone, setting the King of altcoin into a deep plunge.
Is your portfolio green? Check out the ETH Profit Calculator
ETH could break below its lower parallel channel’s boundary of $1,540.69 and aim at the bearish target of $1,408 in the next couple of days.
The drop could offer short-selling opportunities at $1,511.36, $1,470.54, and $1,408.98 if the $1,540 support fails to keep the plunge in check.
However, a break above the channel’s boundary of $1,678 would invalidate the above bias. As such, short-sellers should place their stop-losses above this level. Such an upswing could tip bulls to target the $1,800 zone. But bulls must clear the overhead resistance at $1,716.37 to gain leverage.
The RSI was bearish on the 12-hour timeframe chart and exhibited an increasing divergence from ETH’s price action, which pointed to a possible weakening of ETH’s market structure. But the fluctuating demand, as shown by the OBV (On Balance Volume), could further set ETH in its sideways structure.
ETH saw a steady accumulation in the past few weeks
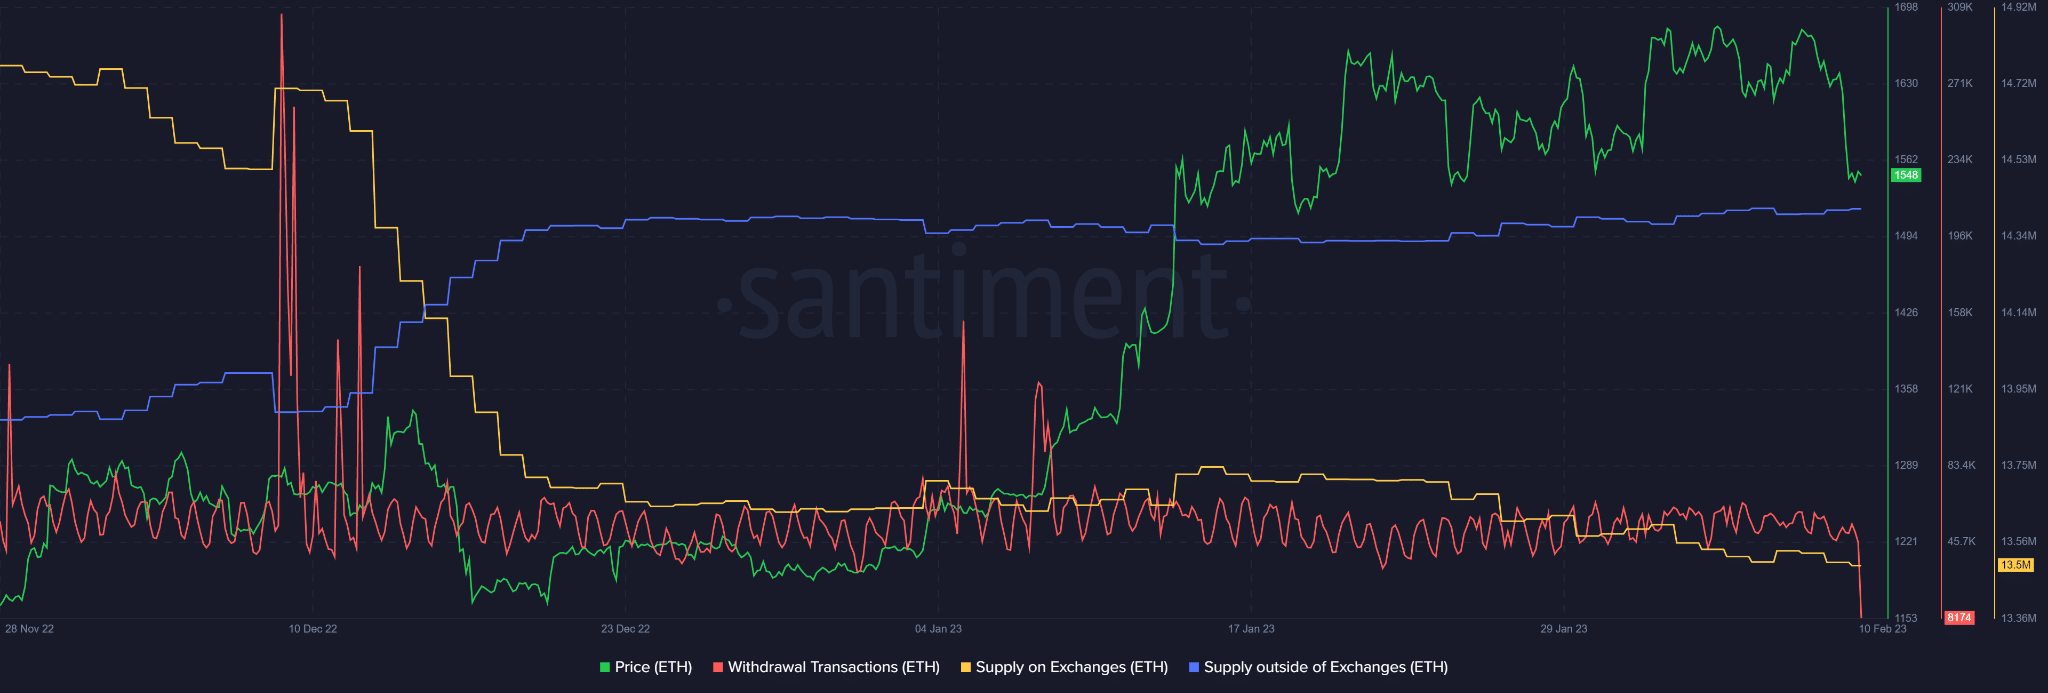
Source: Santiment
As per Santiment, ETH saw a steady accumulation phase since mid-December 2022, as shown by the rising supply outside of exchanges.
The declining supply on exchange confirms the demand for ETH in the same period. If the accumulation trend continues, ETH could rebound from the lower channel pattern’s boundary, invalidating the bearish bias described above.
At press time, the withdrawal transactions dropped significantly, showing that incoming and outgoing transactions involving ETH fell.
It means there was short-term sell pressure at the time of writing. If the selling pressure increases because of the freeing up of locked ether, about 14% of the supply, due to the incoming update in March, ETH could drop to the $1,400 zone.