
Ethereum price is still struggling to clear the $1,660 resistance zone against the US Dollar. ETH must surpass $1,660 and $1,700 to start a fresh increase in the near term.
- Ethereum is correcting lower from the $1,660 resistance zone.
- The price is trading near $1,620 and the 100 hourly simple moving average.
- There was a break below a major bullish trend line with support near $1,640 on the hourly chart of ETH/USD (data feed via Kraken).
- The pair could gain bearish momentum if there is no close above the $1,660 resistance zone.
Ethereum Price Fails Again
Ethereum price attempted a fresh increase from the $1.600 support zone. ETH climbed above the $1,640 level, but the bears were active near the $1,660 resistance zone. A high was formed near $1,665 and the price started another decline, similar to bitcoin.
There was a move below the $1,640 level. Besides, there was a break below a major bullish trend line with support near $1,640 on the hourly chart of ETH/USD.
Ether price even spiked below $1,620 and tested the 50% Fib retracement level of the upward move from the $1,558 swing low to $1,665 high. It is now trading near $1,620 and the 100 hourly simple moving average. On the upside, the price is facing resistance near the $1,640 level.
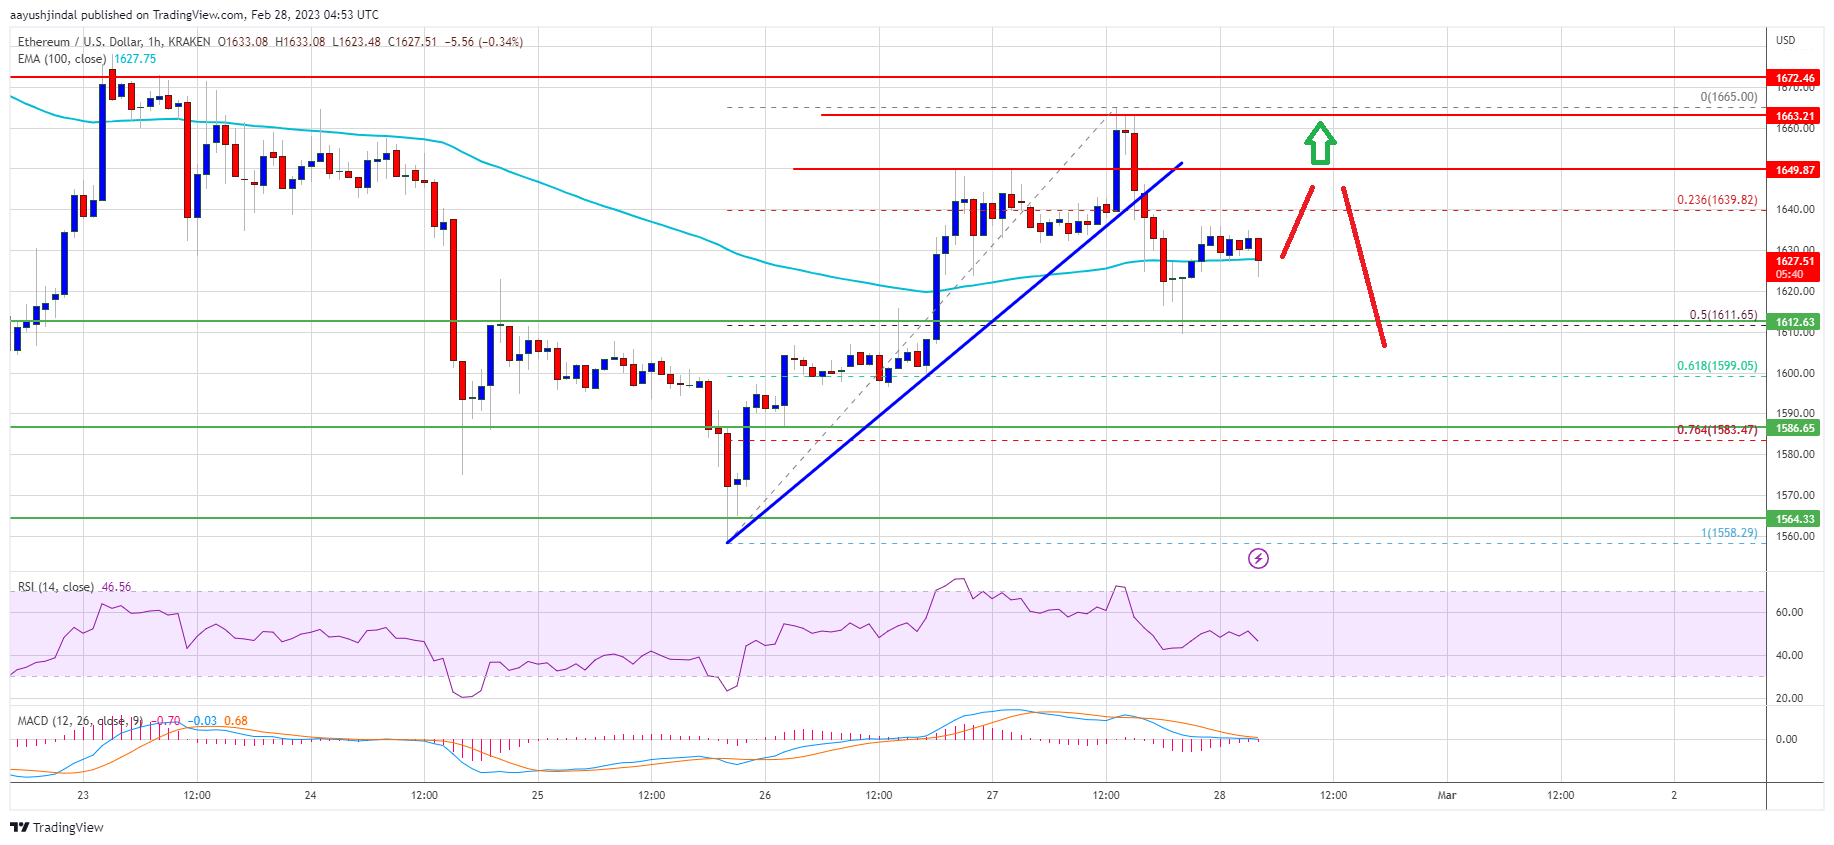
Source: ETHUSD on TradingView.com
The first major resistance is near the $1,660 zone. The next major resistance is near the $1,670 zone. A close above the $1,670 resistance zone might start a steady increase towards the $1,740 level. Any more gains might open the doors for a move towards the $1,800 level.
More Losses in ETH?
If ethereum fails to clear the $1,660 resistance, it could continue to move down. An initial support on the downside is near the $1,610 level.
The next major support is near the $1,600 zone or the 61.8% Fib retracement level of the upward move from the $1,558 swing low to $1,665 high. If there is a break below $1,600, the price might gain bearish momentum and test the $1,565 support. Any more losses might call for a test of the $1,500 level.
Technical Indicators
Hourly MACD – The MACD for ETH/USD is now losing momentum in the bearish zone.
Hourly RSI – The RSI for ETH/USD is now below the 50 level.
Major Support Level – $1,600
Major Resistance Level – $1,660