
Bitcoin Cash price is holding the key $180 support against the US Dollar. BCH seems to be aiming for a fresh increase toward the $205 and $220 levels.
- Bitcoin cash price is showing positive signs above the $180 level against the US Dollar.
- The price is trading below $200 and the 100 simple moving average (4 hours).
- There was a break above a major bearish trend line with resistance near $189 on the 4-hour chart of the BCH/USD pair (data feed from Kraken).
- The pair is likely to accelerate higher if it clears $197 and $200.
Bitcoin Cash Price Aims Higher
In the past few days, Bitcoin Cash price saw a steady decline below $205. BCH even traded below the $195 level, but the downsides were limited compared to Bitcoin and Ethereum.
The price remained well-bid near the key $180 support. A low has formed near $180 and the price is now attempting a fresh increase. It broke the $185 level. There was a break above a major bearish trend line with resistance near $189 on the 4-hour chart of the BCH/USD pair.
The price is now testing the 23.6% Fib retracement level of the downward move from the $238 swing high to the $180 low. However, Bitcoin Cash is now trading below $200 and the 100 simple moving average (4 hours).
Immediate resistance is near the $197 level and the 100 simple moving average (4 hours). The next major resistance is near $205 or the 50% Fib retracement level of the downward move from the $238 swing high to the $180 low.
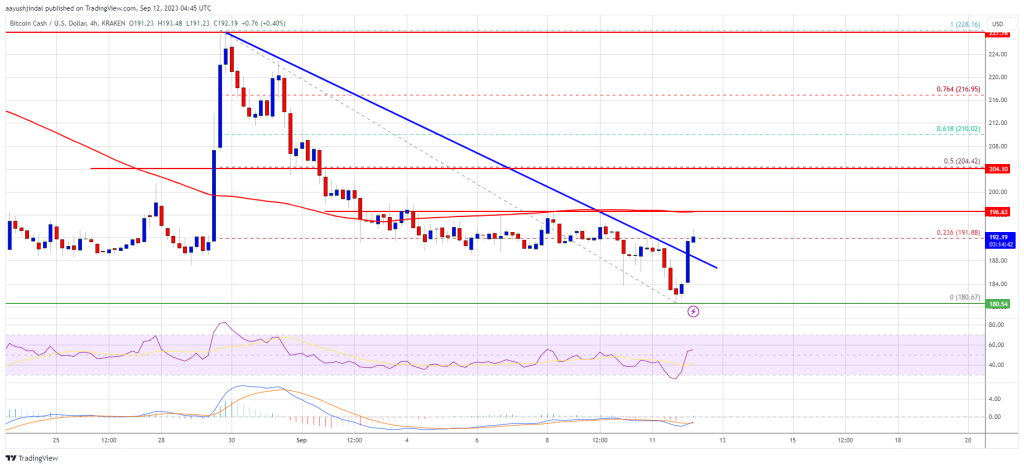
Source: BCH/USD on TradingView.com
Any further gains could lead the price toward the $220 and $225 resistance levels in the near term. The next major hurdle is near the $240 level.
Dips Supported in BCH?
If Bitcoin Cash price fails to clear the $205 resistance, it could start a fresh decline. Initial support on the downside is near the $185 level.
The next major support is near the $180 level, where the bulls are likely to appear. If the price fails to stay above the $180 support, the price could test the $168 support. Any further losses could lead the price toward the $150 zone in the near term.
Technical indicators
4-hour MACD – The MACD for BCH/USD is gaining pace in the bullish zone.
4-hour RSI (Relative Strength Index) – The RSI is currently above the 50 level.
Key Support Levels – $185 and $180.
Key Resistance Levels – $197 and $205.