Cover image from Dall-E, Chart from Tradingview
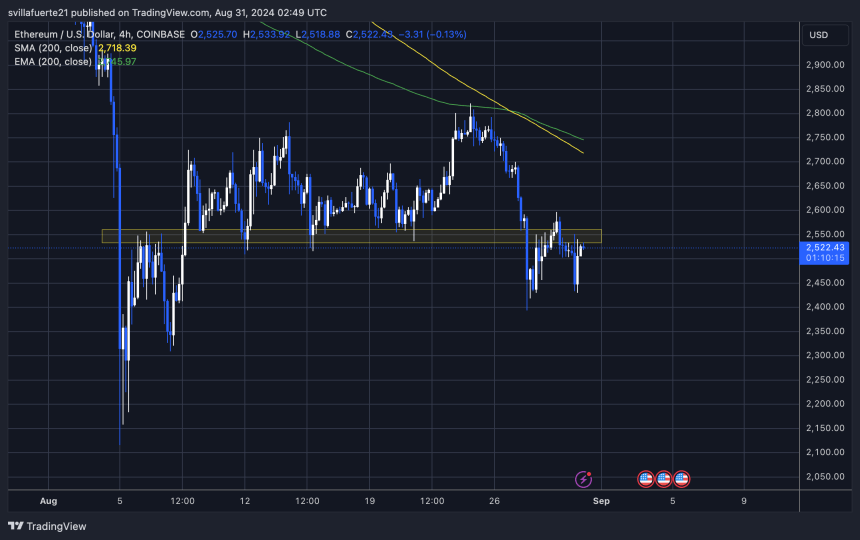
Ethereum (ETH) has been trading within a daily range between $2,300 and $2,800 since the start of August. Over the past three days, the price has struggled to break past the $2,600 mark, raising concerns among analysts and investors.
Related Reading
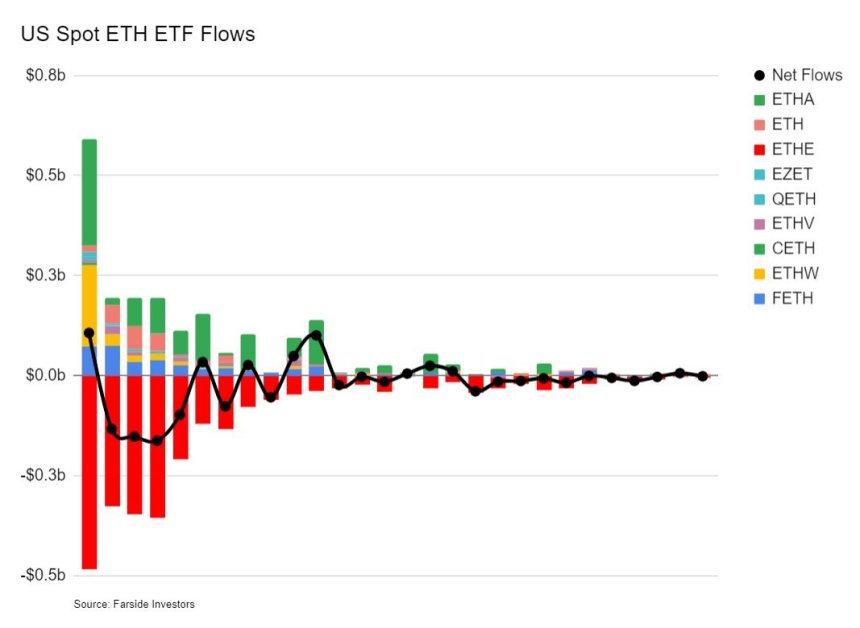
This performance has led to disappointment, particularly when compared to Bitcoin’s stronger showing this year. Critical data from Farside Investors reveals decreasing interest in Ethereum ETFs, which has added to the cautious sentiment surrounding ETH. This decline in interest may indicate broader concerns about Ethereum’s future performance.
As ETH continues to face resistance at the $2,600 level, the market remains uncertain about its ability to break higher. The next few days will be critical in determining whether Ethereum can regain its momentum or if it will continue to lag behind its peers. The market is closely watching these developments, making this a pivotal moment for ETH.
Ethereum ETFs’ Underwhelming Performance
The launch of Ethereum ETFs was anticipated with great excitement, but it quickly became a “sell the news” event. Data from Farside Investors reveals that Ethereum ETFs have flopped in performance since their debut. Both inflows and outflows have gone to virtually zero, reflecting a lack of sustained investor interest. This response contrasts sharply with the enthusiasm that preceded their launch.

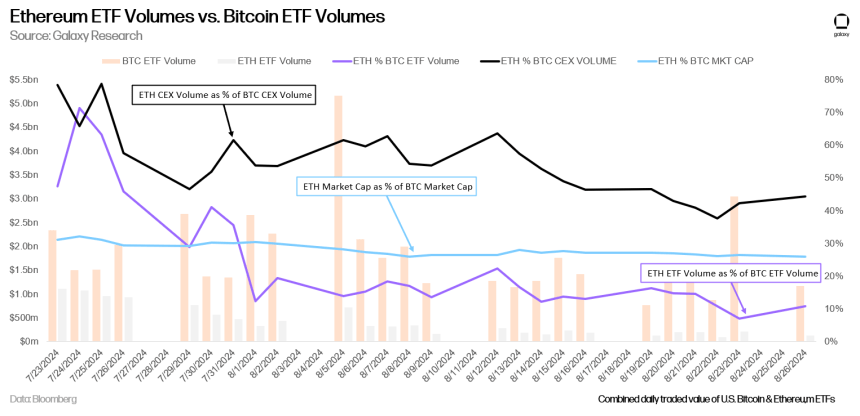
Moreover, Bloomberg data shared by Galaxy Research highlights that Ethereum ETFs are trading at significantly lower volumes compared to Bitcoin ETFs. This discrepancy is notable, particularly when considering the ETH/BTC trading volumes and market cap ratios on centralized exchanges (CEX). Despite Ethereum’s strong market presence, these ETFs are not capturing the same level of investor attention as their Bitcoin counterparts.

The current data suggests that, under prevailing market conditions, investors are more inclined to favor Bitcoin or even explore alternatives like Solana over Ethereum. The lack of enthusiasm for Ethereum ETFs underscores the broader market sentiment, where Bitcoin continues to dominate, leaving Ethereum and its financial products trailing. This development raises questions about the future appeal of Ethereum ETFs and whether they can gain traction in an increasingly competitive market.
Related Reading
ETH Price Action
Ethereum (ETH) is currently trading at $2,522, reflecting a period of uncertainty as it remains below the $2,600 mark since last Tuesday. This price point is significant because $2,600 served as a strong support level throughout most of August. The fact that it has now turned into resistance suggests that ETH could be facing further declines in the near term.

For bulls to regain control and steer the price upward, breaking past the $2,600 resistance is crucial. Should this level be breached, the next target would be the local high of $2,820, signaling a potential bullish reversal. However, if Ethereum fails to reclaim the $2,600 level, it could lead to a continuation of the current downward trend, with the next key support level around $2,310.
Related Reading
This ongoing battle between support and resistance levels highlights the importance of the $2,600 mark in determining Ethereum’s short-term price direction.
