
Ethereum started a strong decline after it failed to surpass $600 against the US Dollar. ETH price declined over 6% and it is now trading near the $550 level.
- Ethereum started a strong decline after it failed to clear the $600 and $602 resistance levels.
- The price broke the key $585 support and settled below the 100 hourly simple moving average.
- There is a key bearish trend line forming with resistance near $590 on the hourly chart of ETH/USD (data feed via Kraken).
- The pair could correct higher, but it is likely to face resistance near $565 and $570.
Ethereum Price Broke Key Support
After many failures, bitcoin and Ethereum declined below the $19,000 and $585 support levels. ETH price gained bearish momentum below the $580 level and it settled well below the 100 hourly simple moving average.
The bears were able to push the price below the $565 support level. Ether price even spiked below the $550 support and traded as low as $541. It is currently correcting higher and trading above the $545 level.
An initial resistance is near the $552 and $555 levels. The 23.6% Fib retracement level of the recent decline from the $595 swing high to $541 low is also near the $554 level. The first major resistance on the upside is near the $565 level (the recent breakdown zone).
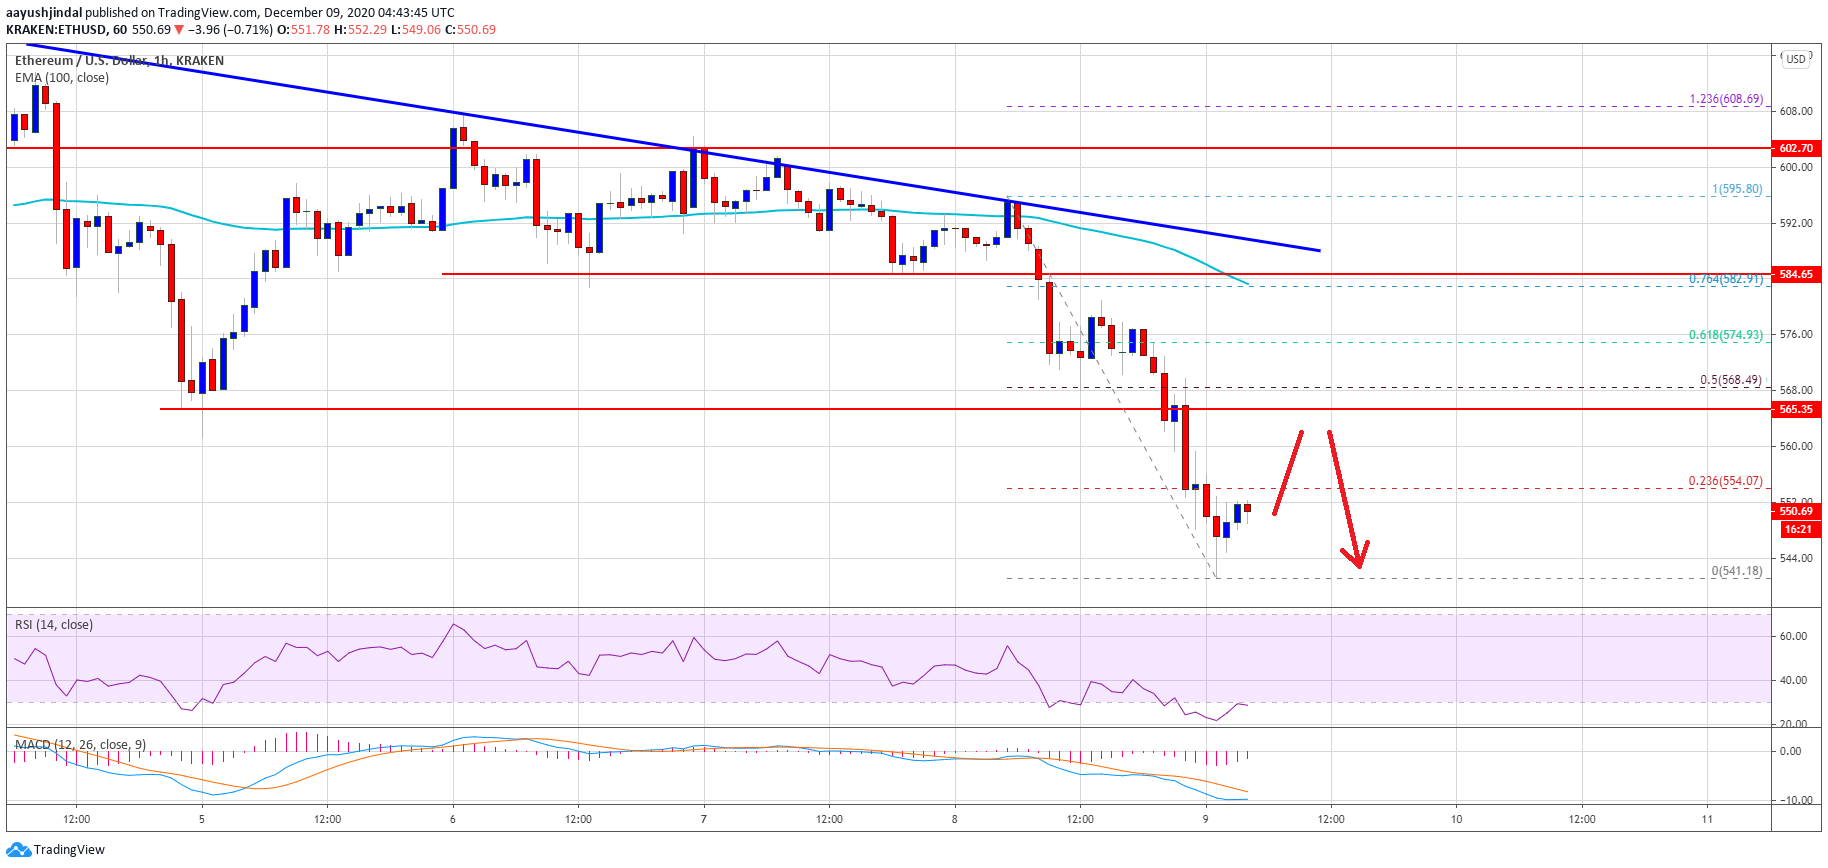
Source: ETHUSD on TradingView.com
The 50% Fib retracement level of the recent decline from the $595 swing high to $541 low is also near the $568 level. Moreover, there is a key bearish trend line forming with resistance near $590 on the hourly chart of ETH/USD.
Therefore, ether price is likely to face a strong selling interest if it recovers above $555 and climbs higher towards the $565 and $570 level in the near term.
More Losses in ETH?
If ethereum fails to clear the $555 and $565 resistance levels, it could continue to move down. An initial support is near the $542 and $540 levels.
A downside break below the $540 support zone may perhaps spark more losses towards the $525 level. The next major support is near the $500 zone, where the bulls are likely to take a stand.
Technical Indicators
Hourly MACD – The MACD for ETH/USD is showing negative signs in the bearish zone.
Hourly RSI – The RSI for ETH/USD is currently well below the 40 level.
Major Support Level – $540
Major Resistance Level – $565